On this page
Understanding resource usage in cPanel
Find out how to read your cPanel resource usage data and what to do when your site hits its limits.
Your hosting plan comes with a defined set of resources - CPU, RAM, I/O, and more. Understanding how your site uses those resources helps you keep it fast, stable, and ready to grow.
What keeps shared hosting fair: CloudLinux
All Kualo shared hosting servers run CloudLinux, which isolates each account in its own container. If a neighbouring site starts consuming excessive resources, CloudLinux throttles it before it can affect yours. The same applies in reverse: if your site starts hitting its limits, CloudLinux steps in to prevent it from impacting others.
This isolation means that performance problems on your site are almost always caused by your own resource usage, not someone else's - which makes diagnosing issues much more straightforward.
Why a site might struggle before it outgrows its plan
High resource usage is not always a sign that you need a bigger plan. There are a few common causes worth ruling out first.
Inefficient code or configuration A site can consume far more resources than necessary if its code, database queries, or caching are not well optimised. Slow queries, unoptimised images, and redundant plugins all add up. Before upgrading, review our guide on optimising your website.
Unwanted bot traffic Bots, scrapers, and malicious crawlers can consume significant resources without generating any real business value. If your resource usage is high but genuine traffic is not, bots may be the cause. See our guide on managing bot traffic for detection and mitigation strategies.
Legitimate growth If you have optimised your site and ruled out unwanted traffic, and resource usage is still consistently high, it is likely time to consider a larger plan. Options include Business Web Hosting, managed VPS, and dedicated servers. If you are unsure which is right for you, contact us.
Understanding your resources
The table below explains each resource your hosting plan allocates, and what happens when you reach the limit.
| Resource | Description | Impact of reaching the limit |
|---|---|---|
| CPU | Maximum CPU cores your site can use. | Tasks queue for available CPU power, slowing the site down. |
| Memory (RAM) | Maximum RAM your applications can use. | Processes terminate unexpectedly, causing 500 or 503 errors. |
| Entry processes (EP) | Maximum simultaneous PHP requests your site can handle. | New requests are rejected, causing 503 errors for new visitors. |
| Number of processes (NPROC) | Maximum total tasks that can run at once. | All process types are affected; can cause 503 errors or stop email working. |
| I/O usage | Speed limit for data moving to and from storage. | Operations slow down but do not stop, similar to traffic congestion. |
| IOPS | Maximum read/write operations per second. | Read/write operations pause briefly until the next second. |
| Inodes | Total number of files and folders you can have. | No new files can be created, affecting site functionality and email. |
CPU, I/O, and IOPS faults throttle speed but do not cause errors. NPROC, EP, and RAM (PMEM) faults can terminate processes or block new ones, which may result in 503 or 500 errors.
How to access resource usage
- Log in to cPanel.
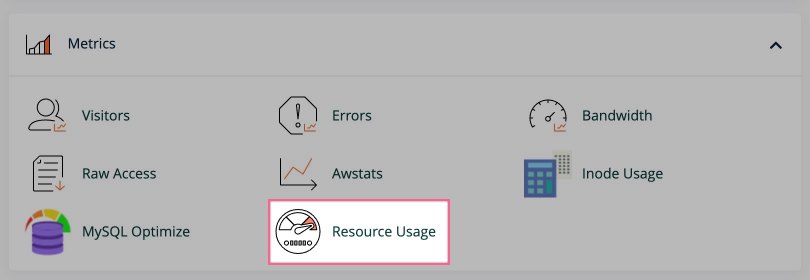
- Search for or scroll to the Resource Usage icon and click it.
Dashboard overview
The Resource Usage dashboard shows whether your site has hit any resource limits in the last 24 hours.
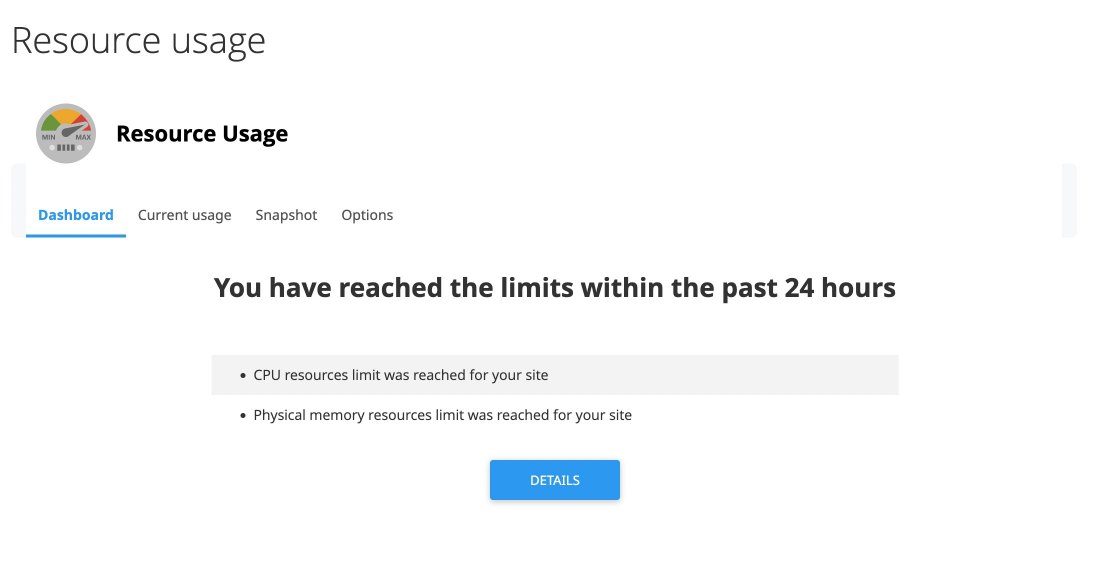
This is particularly useful if you have recently seen a 503 error or unusually slow performance. It lets you quickly confirm whether resource limits were the cause.
A few things to keep in mind:
- The dashboard only shows the last 24 hours. Limits shown as reached may no longer be an issue right now.
- No alerts on the dashboard does not mean there have been no issues beyond the last 24 hours.
- If you see a View Details alert, clicking it takes you to the Current Usage tab for more information.
Current usage tab
The Current Usage tab gives you a detailed view of resource consumption, both in real time and over a selectable historical period.
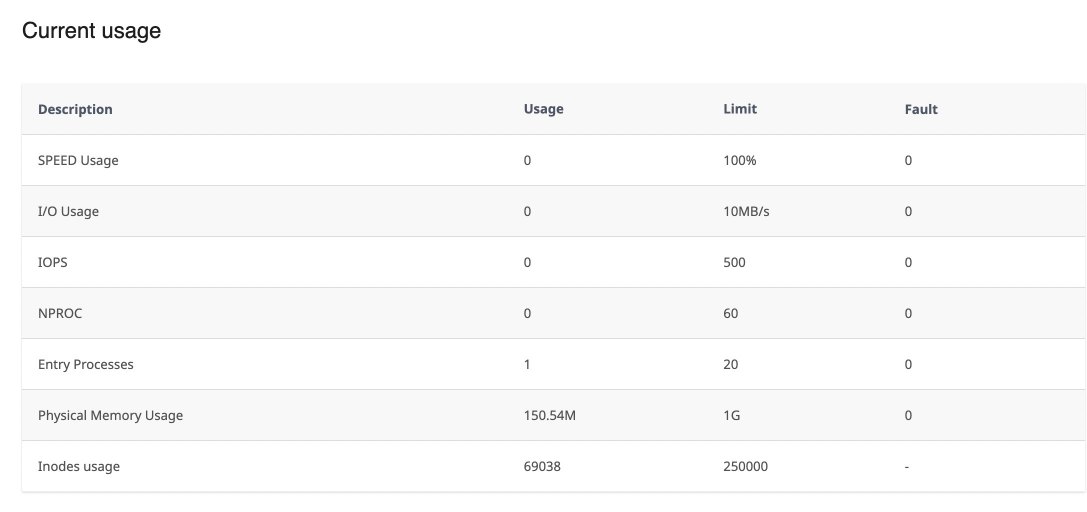
Real-time usage table
At the top of the tab, a table shows current live usage of CPU, RAM, entry processes, and other resources.
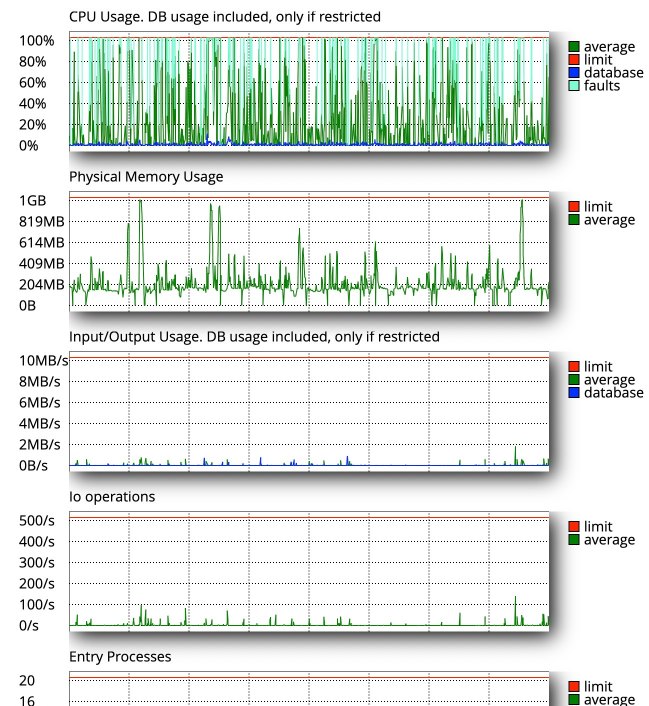
Usage graphs
Below the table, graphs show resource usage over the selected time period, highlighting spikes and periods of high consumption.
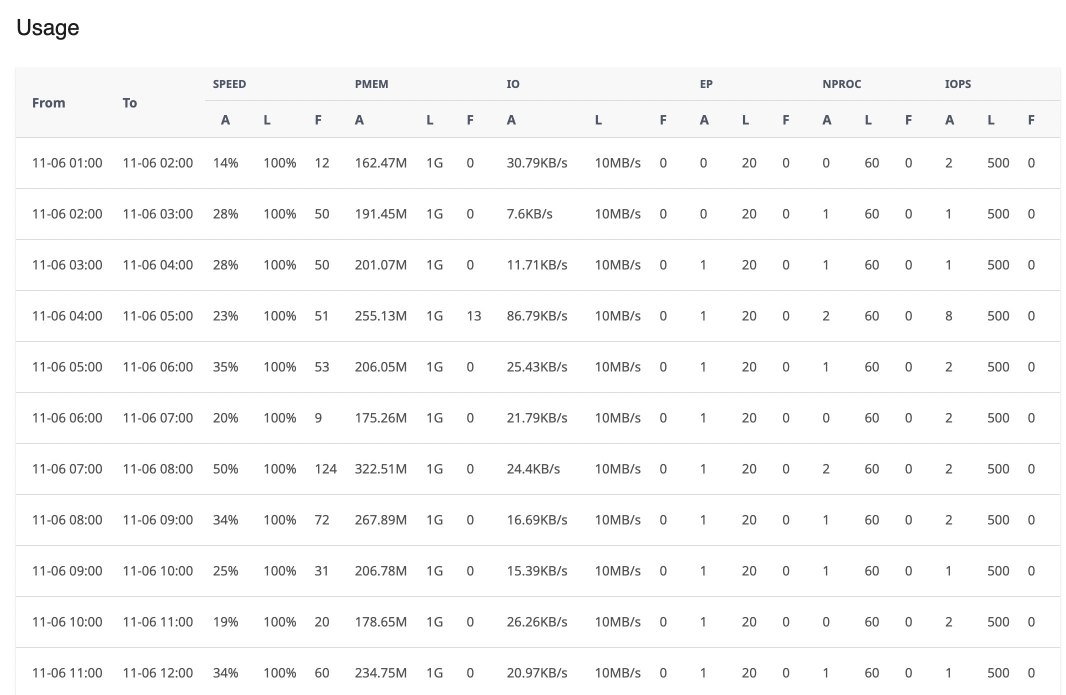
Hourly breakdown table
Below the graphs, a table breaks down usage hour by hour over the same period.
Reading the graphs
Each graph uses a consistent colour scheme:
- Green line (average): Average resource usage over the selected period. Use this to spot general trends.
- Red line (limit): The maximum your plan allows. Usage approaching or hitting this line means you are near capacity.
- Blue line (database): Appears only when database usage is tracked separately. Shows how much of the resource database operations are consuming.
- Light blue markers (faults): Each marker indicates a point where your site exceeded the resource limit. CPU, I/O, and IOPS faults cause slowdowns; NPROC, EP, and RAM faults can cause errors.
The final graph is the Fault Graph, which breaks down faults by resource type using different colours.
Spotting trends
- Consistent patterns vs. spikes: Steady usage suggests normal operation. Sudden spikes may indicate a traffic surge, a new plugin, or a scheduled task.
- Usage near the red line: Consistently operating close to your limit, especially alongside faults, suggests your plan may need upgrading or your site needs optimisation.
- Repeated faults on a specific resource: If the same resource faults regularly, that is where to focus your optimisation effort.
Practical applications
- Performance diagnostics: If your site slows down when the CPU or I/O graph peaks at the limit, resource constraints are likely the cause.
- Capacity planning: A rising trend in resource usage month on month is a signal to consider upgrading before limits become a bottleneck.
- Optimisation verification: After making changes such as enabling caching, check the graphs to confirm whether resource usage has improved.
What to watch out for
- Regular faults: More than ten faults within an hour is a sign of a persistent problem, not a momentary spike.
- High usage during off-peak hours: This can indicate background tasks (backups, automated scripts) or malicious activity such as a brute-force attack.
- Consistently maxed-out resources: Any resource that is permanently at its limit needs immediate attention to prevent downtime.
Hourly breakdown table columns
Each row in the table covers one hour. For each resource, three sub-columns are shown:
| Column | Meaning |
|---|---|
| A (Actual) | The actual usage during that hour. |
| L (Limit) | The limit set by your hosting plan. |
| F (Faults) | The number of times usage exceeded the limit during that hour. |
You can sort by any column. Sorting by faults is a quick way to find the hours where resource limits were most frequently exceeded.
Adjusting the timeframe
By default, graphs and tables show the last 24 hours. You can change this using the Timeframe dropdown at the top of the graphs.
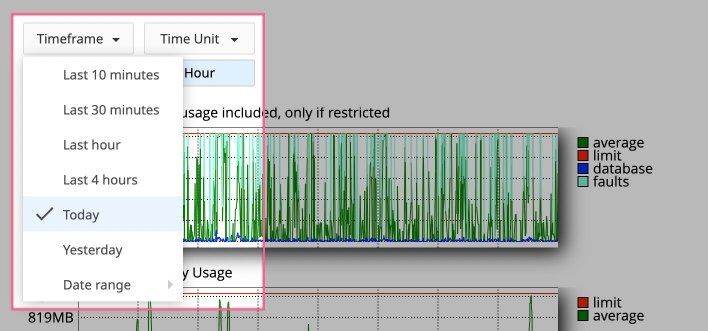
The adjacent Time Unit dropdown controls the granularity of the data:
- Minute - useful for short windows of a few hours
- Hour - the default; good for 24-hour to multi-day views
- Day - best for reviewing weeks of data at a glance
When reviewing extended historical data, look for recurring peaks that align with specific events - a new plugin deployment, a marketing campaign, or a scheduled backup - to understand what is driving usage.
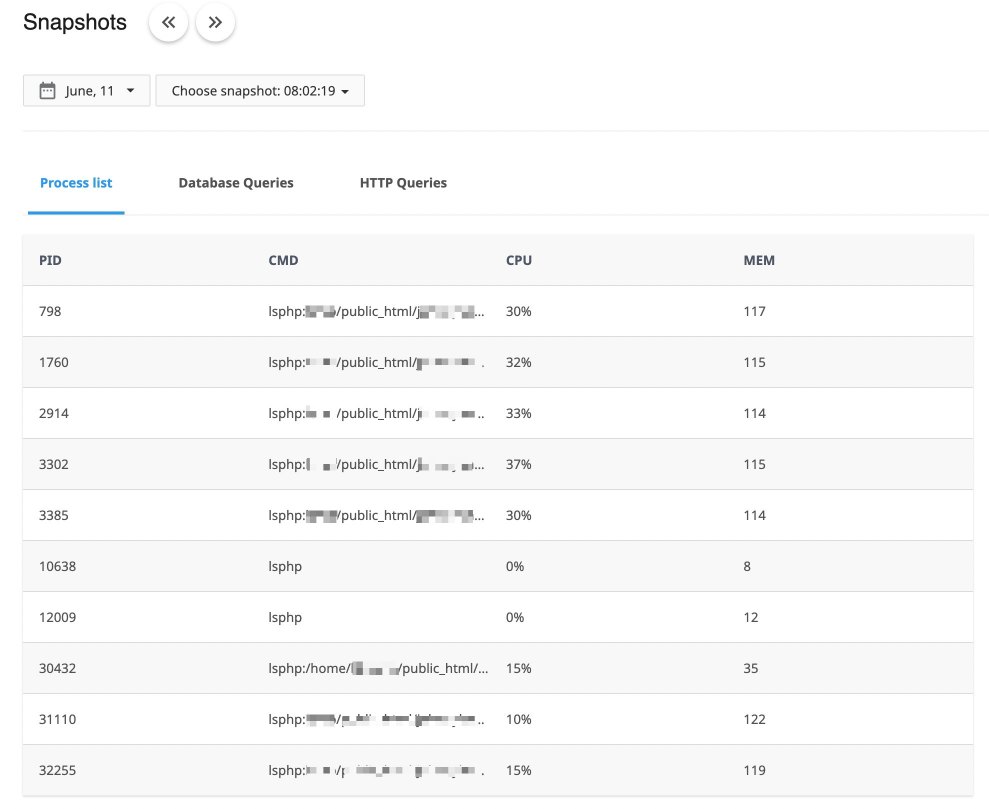
Snapshots tab
The Snapshots tab records a detailed picture of your account at the moment a fault occurred. It is the most useful tool for diagnosing what was actually running when a resource limit was hit.
Snapshots are divided into three subtabs:
- Processes: Lists all active processes at the time of the snapshot, including the process ID (PID), the command that was running (CMD), and CPU and memory usage per process. Note that many requests may appear to route through a single entry point such as
index.php, which can limit how precisely you can identify the source.
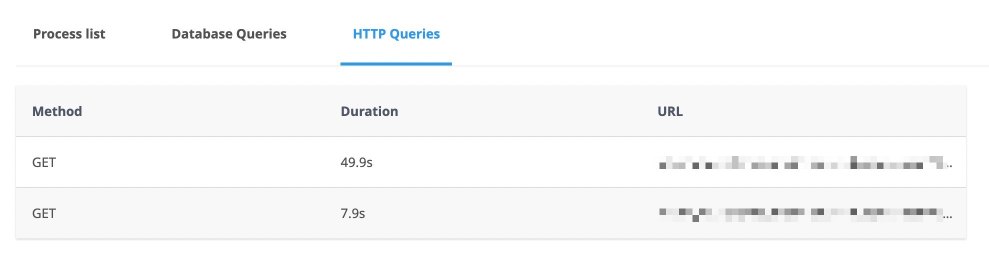
- HTTP queries: Shows which URLs were being requested at the time of the snapshot. This is often more useful than the Processes tab for tracing which pages or endpoints are driving high resource usage.
- MySQL queries: Lists all SQL queries running at the time of the snapshot. Useful for identifying slow or inefficient database queries that may be contributing to high resource usage.
If faults occurred over an extended period, multiple snapshots will be available. Review several snapshots around the time of the issue to build a complete picture. Use the date and time dropdowns at the top of the tab to navigate between them.
Snapshot times are displayed in your local browser time, making it easier to correlate them with issues you or your users reported.
Addressing resource limits with Resource Boost
If your site is regularly hitting its resource limits, the Resource Boost feature can provide immediate temporary relief while you work on a longer-term fix.
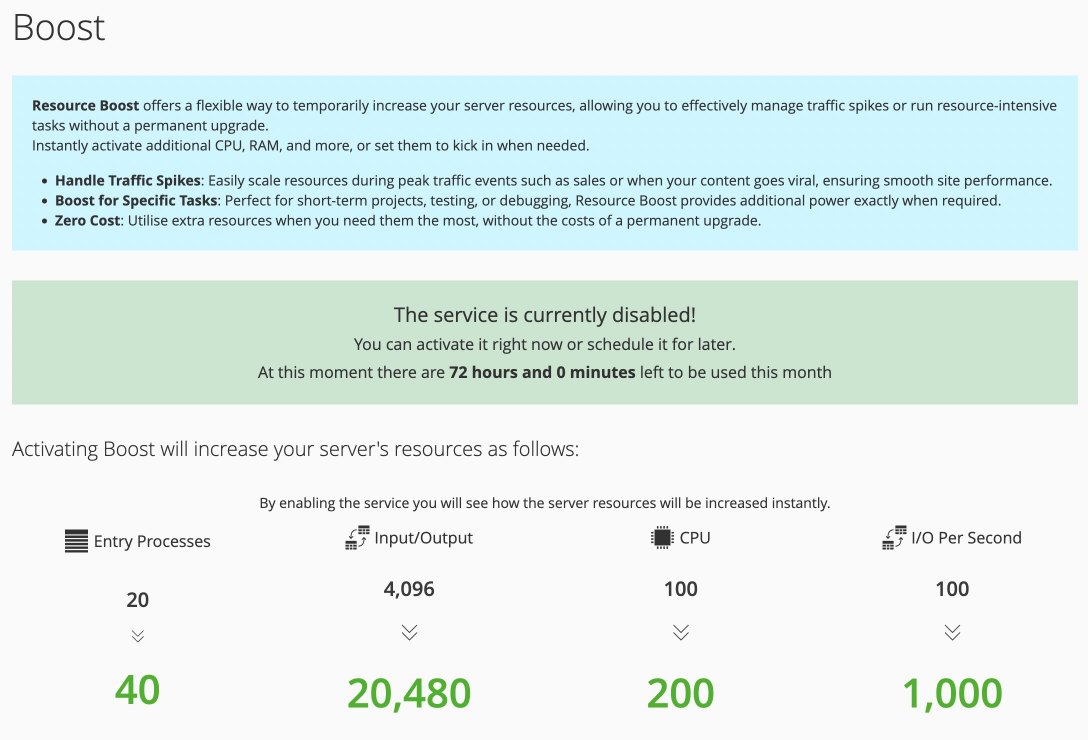
Resource Boost temporarily increases your account's resource allowances. It is useful in three situations:
- Immediate relief: Activating a boost can stabilise a site that is actively hitting limits, restoring performance while you investigate.
- Optimisation window: The extra headroom gives you time to make and test optimisations without the site degrading in the meantime.
- Short-term bridge: It can serve as a temporary measure while you evaluate whether a permanent plan upgrade is needed.
Resource Boost is a short-term tool, not a permanent solution. If your site consistently needs more resources than your plan provides, optimisation or a plan upgrade is the right long-term answer.
Common optimisation techniques
| Technique | Description | Impact on resource usage |
|---|---|---|
| Enable OPcache | Caches compiled PHP code to avoid recompiling on every request. | Reduces CPU usage by eliminating repeated PHP compilation. |
| Update PHP version | Upgrade to the latest supported PHP version. | Newer versions are faster and use less memory. |
| LiteSpeed Cache | Server-level caching for sites on LiteSpeed servers. | Serves cached pages instead of generating them dynamically, significantly reducing PHP load. Requires a LiteSpeed-compatible application. |
| General page caching | Plugin or application-level page caching. | Reduces PHP load for applications not compatible with LiteSpeed Cache. |
| Redis / Memcached | In-memory object caching. | Reduces database load by storing frequently accessed data in memory. Can be used alongside page caching in WordPress, Magento, and others. |
| MySQL optimisation | Optimise queries and use efficient storage engines such as InnoDB. | Improves query efficiency, reducing PHP execution time and database load. |
| CDN | Distribute static content delivery via a content delivery network. | Reduces server load for static assets and can reduce bot activity hitting your origin server. |
| System cron jobs for WordPress | Replace WP-Cron with real system cron jobs. | Prevents background tasks (such as backups) from running on page load, reducing PHP process usage. |
| WordPress admin-ajax optimisation | Reduce or optimise use of admin-ajax.php. |
Cuts unnecessary PHP processes triggered by excessive AJAX requests. |
| Efficient 404 handling | Prevent dynamically generated 404 pages for missing static files. | Stops the server spawning PHP processes for missing assets, reducing CPU and memory load. |
| Reduce plugins | Remove unnecessary or resource-heavy plugins. | Simplifies PHP execution and reduces database queries. |
| Improve inefficient code | Review and refactor poorly written code. | Reduces CPU, memory, and I/O usage by streamlining application logic. |