On this page
How to view your website statistics in cPanel
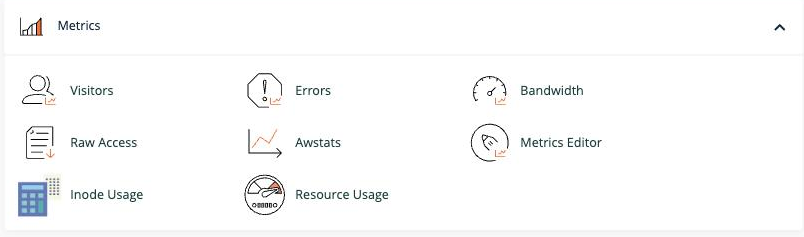
cPanel's Metrics section includes AWStats, Visitors, Bandwidth, Errors, and Raw Access - tools for understanding your website's traffic and resource usage.
cPanel's Metrics section gives you several tools for understanding your website's traffic and resource usage. The most detailed is AWStats, but alongside it you can see your latest visitors, check your bandwidth, review your error log, download your raw logs, and see which statistics programs are running.
Opening the Metrics tools
Log in to cPanel and find the Metrics section.
AWStats
AWStats is the most detailed of the traffic tools, breaking your visits down into counts, page views, hourly patterns, and more.
- In the Metrics section, click Awstats.
- You will see a list of the domains on your account. Click View next to the domain you want to check.
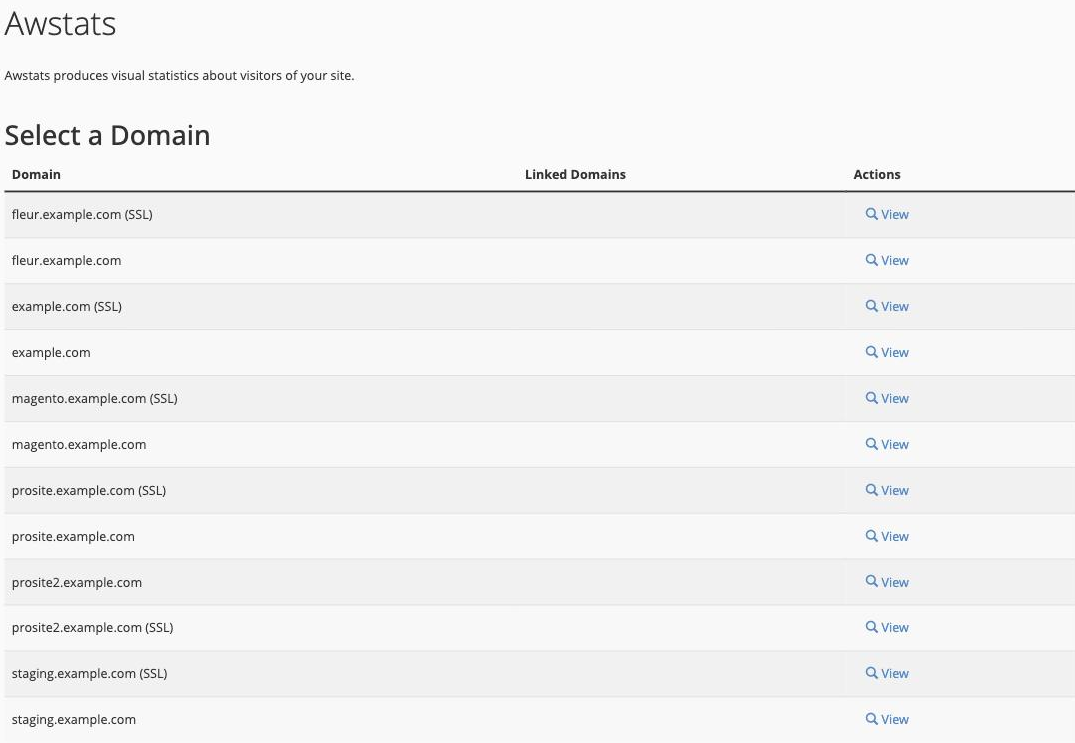
This opens the main AWStats page for that domain, where you can explore your traffic in several ways:
- Monthly summary - use the month and year selectors at the top to view a specific period.
- Hourly breakdown - scroll down to the hourly table to see which times of day are busiest.
- Other reports - AWStats also breaks visitors down by country, the pages they viewed, how they found your site, and more.
Visitors
The Visitors tool shows up to 1,000 of the most recent entries in a domain's web server log - each visitor's IP address, the page they requested, the time, and more. It is useful for a quick, live look at who is hitting your site right now.
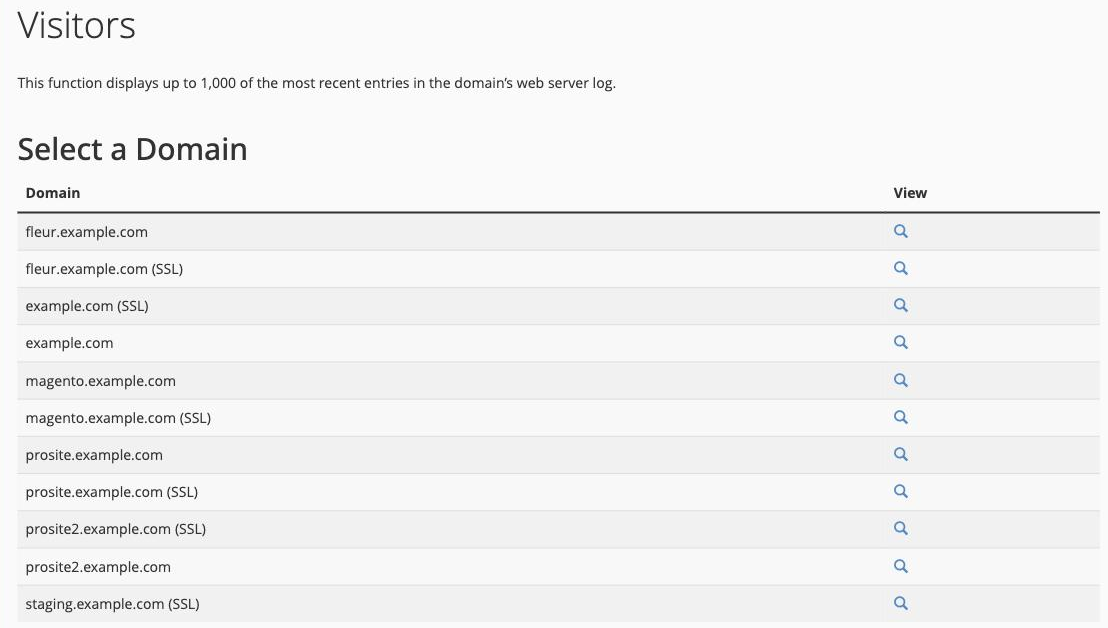
Click the View icon next to the domain you want to inspect to open its list of recent visitors.
Bandwidth
The Bandwidth tool shows how much data your account has transferred, which helps you see how busy your site is and keep an eye on your plan's allowance.
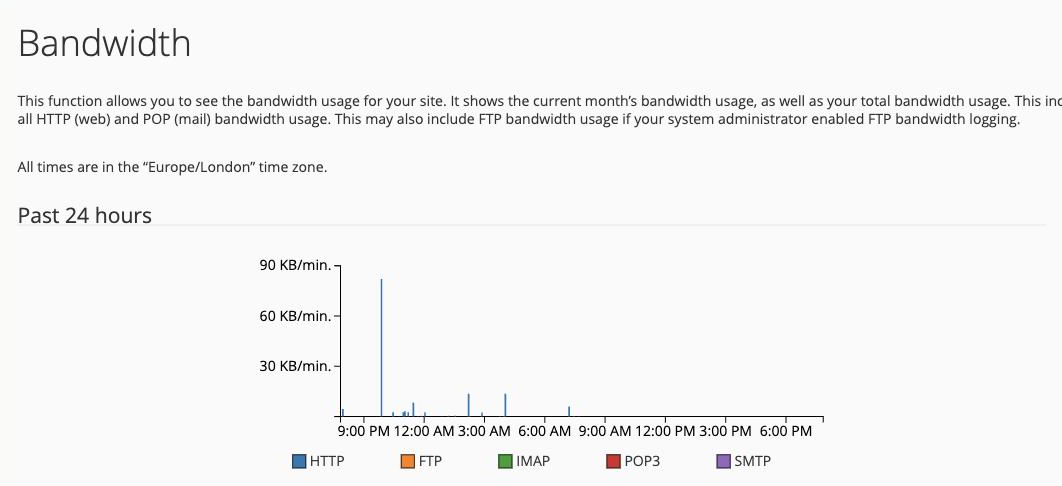
It charts your usage over the past day, week, month, and year, and breaks it down by type of traffic - HTTP (web), FTP, and the mail protocols IMAP, POP3, and SMTP.
Errors
The Errors tool shows the most recent entries from your website's error log - the first place to look when something on your site is not working.
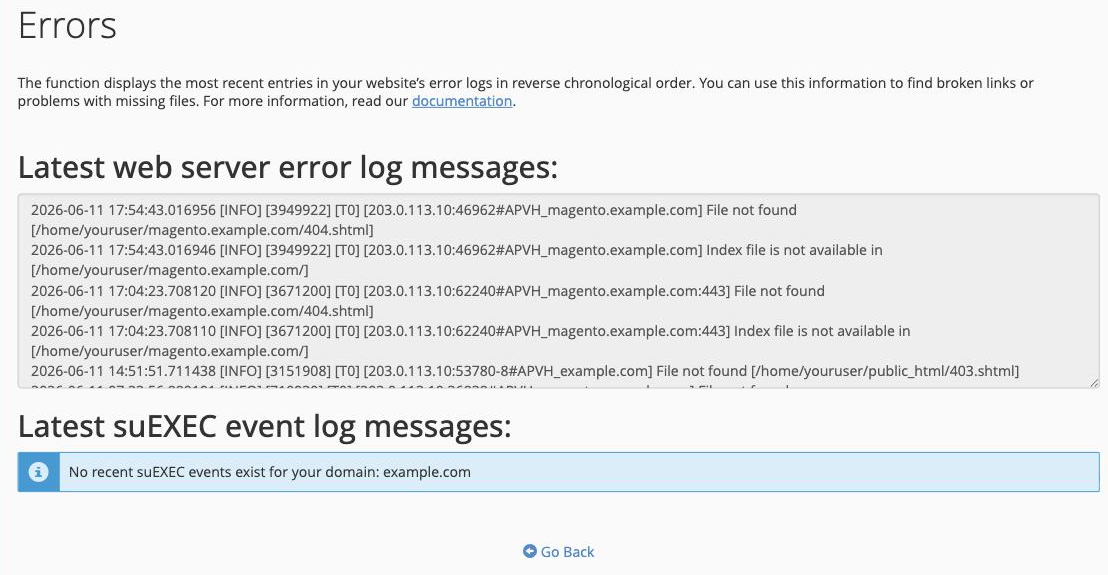
Each line records an error the server hit, such as a missing file (a 404) or a script problem, along with the time and the file involved.
Raw Access
Raw Access lets you download your raw web server logs - the unprocessed record of every request to your site - for your own analysis.
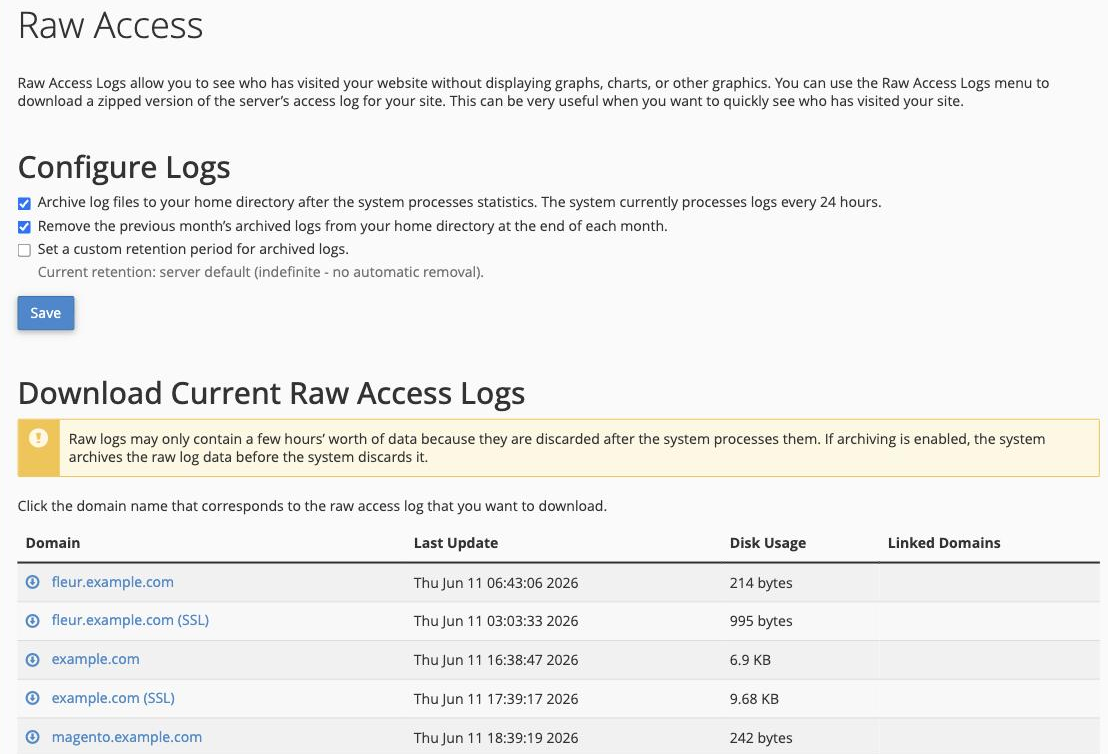
Under Configure Logs you can choose whether cPanel archives each month's logs in your home directory, and set how long to keep them. Under Download Current Raw Access Logs, click a domain to download its current log.
Metrics Editor
The Metrics Editor shows which statistics programs are set up for each of your domains.
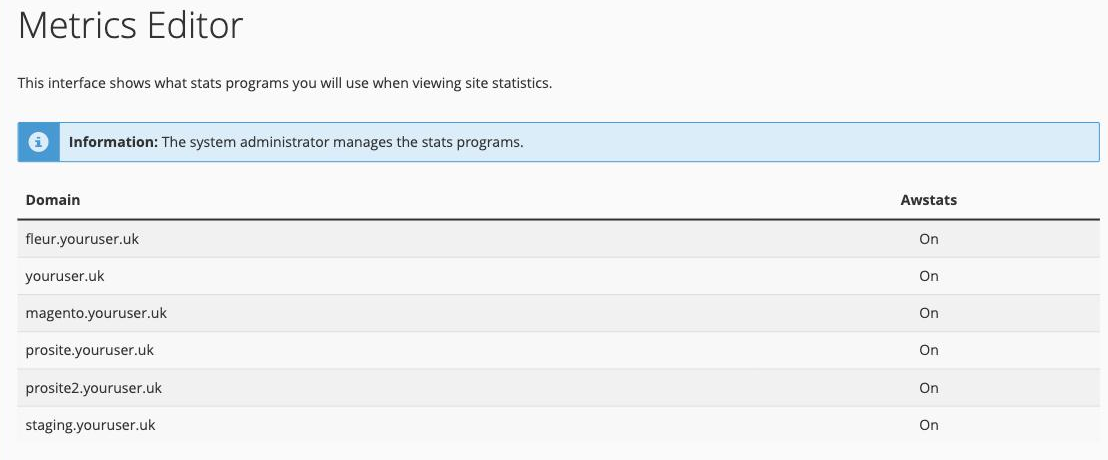
On our servers AWStats is enabled and managed for you, so this page is mainly for reference - it confirms that statistics are being collected for each domain.
Statistics are processed periodically, so a brand-new site - or a change you just made - can take up to a day to show up in AWStats.