On this page
How to spot slow running extensions in Magento
Use Magento's built-in Profiler to find extensions and SQL queries that are slowing down your store.
Magento's extensibility is one of its strengths, but poorly coded third-party extensions can seriously harm your site's performance. If your store is slow and otherwise well optimised, the Varien Profiler can help you pinpoint exactly what is causing the bottleneck.
Quick check: disable unused extensions first
Before reaching for the Profiler, try disabling any modules or extensions you do not actively need. This is often the fastest way to recover performance without any code changes.
About the Profiler
The Varien Profiler monitors the time and memory allocation of your application's loading cycle. It breaks down each block of code so you can see which extensions or queries are the slowest.
Never run the Profiler on a live production site. It exposes detailed information about how your pages load and how your system is configured - information that could be exploited by anyone trying to compromise your store. Use it only in a development environment.
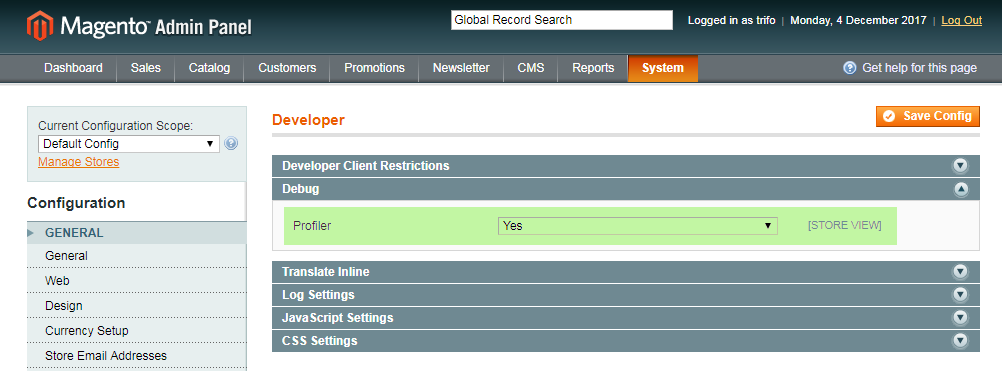
Enable the Profiler
- In the Magento admin panel, go to System > Configuration > Advanced > Developer > Debug.
- Set Profiler to Yes.
Tell the Profiler what to monitor
With the Profiler switched on, you need to activate it in code. The simplest approach is to edit Magento's index.php file.
- Open
index.phpin the root of your Magento installation. - Find the following line near the bottom of the file:
#Varien_Profiler::enable();
- Remove the
#at the start to uncomment it:
Varien_Profiler::enable();
- Save the file.
Read the Profiler output
Reload any Magento page and scroll to the bottom. You will see a [Profiler] link. Click it to expand a table of statistics.
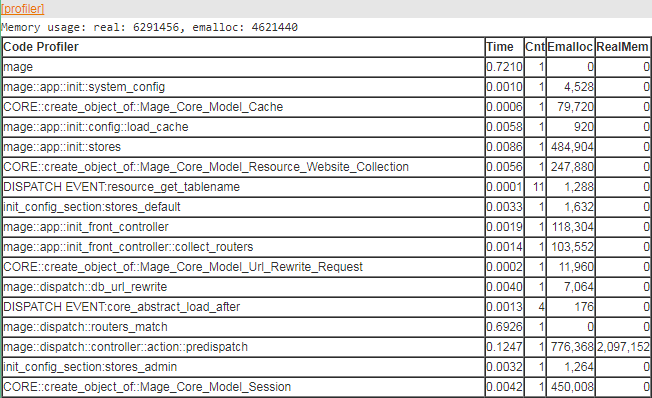
The table columns are:
| Column | What it shows |
|---|---|
| Code Profiler | The name of the timer or code block being measured |
| Time | How long that block of code took to execute |
| Cnt | How many times the timer with that name was started |
| Emalloc | Memory allocated to PHP, using memory_get_usage() without the true parameter, minus timer values |
| RealMem | Memory allocated to PHP, using memory_get_usage(true), minus timer values |
Look for rows with a high Time value - these are your performance bottlenecks. Extension-related blocks will typically show their module name in the Code Profiler column.
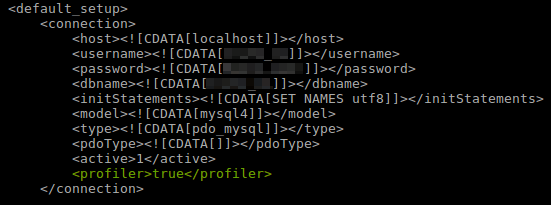
Enable SQL profiling
To see database query statistics alongside the standard output, open your Magento local.xml configuration file and add the following inside the connection node:
<profiler>true</profiler>
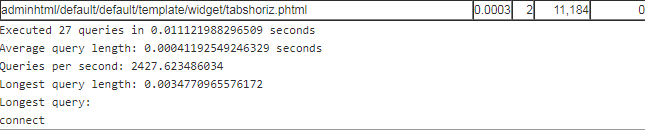
Reload a page and scroll to the bottom of the Profiler output. You will now see SQL query statistics alongside the standard code profiling data.
If you need any further help, please contact us.