On this page
How to read speed reports (GTmetrix, Pingdom, PageSpeed)
Learn how to run and interpret GTmetrix, Pingdom and Google PageSpeed Insights reports so you can understand what is actually slowing your site down.
Speed testing tools like GTmetrix, Pingdom and Google's PageSpeed Insights give you a wealth of data about your site - but the results are easy to misread. This article explains what each tool is actually measuring and how to act on what you find.
Understanding TTFB
Before diving into the tools, it helps to understand TTFB (Time to First Byte), because it appears throughout all three reports. TTFB is simply how long it takes for a visitor's browser to receive the first response from your server after making a request.
Two factors drive TTFB:
- Site code - Most sites today run on a CMS such as WordPress or Magento. The number of plugins installed, slow or unindexed database queries, and uncached page generation all add time before the server can respond.
- Server processing speed - The server hardware itself is rarely the bottleneck. The more common culprits are an outdated PHP version without OPcache (see how to change your PHP version in cPanel) and an unoptimised database.
The single biggest improvement you can make to TTFB is enabling dynamic caching. When the server can serve a cached page instead of generating it from scratch on every request, response times drop significantly and overall resource usage falls too.
Improving TTFB with LiteSpeed Cache
The simplest and most effective option on Kualo hosting is to enable and configure LiteSpeed Cache. It is more than a caching layer - it is a full optimisation suite that can:
- Minify and combine HTML, CSS and JS
- Optimise your image gallery
- Limit WordPress Heartbeat executions
If LiteSpeed Cache is not available on your plan and your site runs WordPress, W3 Total Cache or WP Fastest Cache are good alternatives. Kualo has a guide to recommended WordPress caching plugins to help you choose.
For WordPress sites, replacing wp-cron with a real cron job in cPanel also makes a noticeable difference to TTFB and overall performance.
GTmetrix
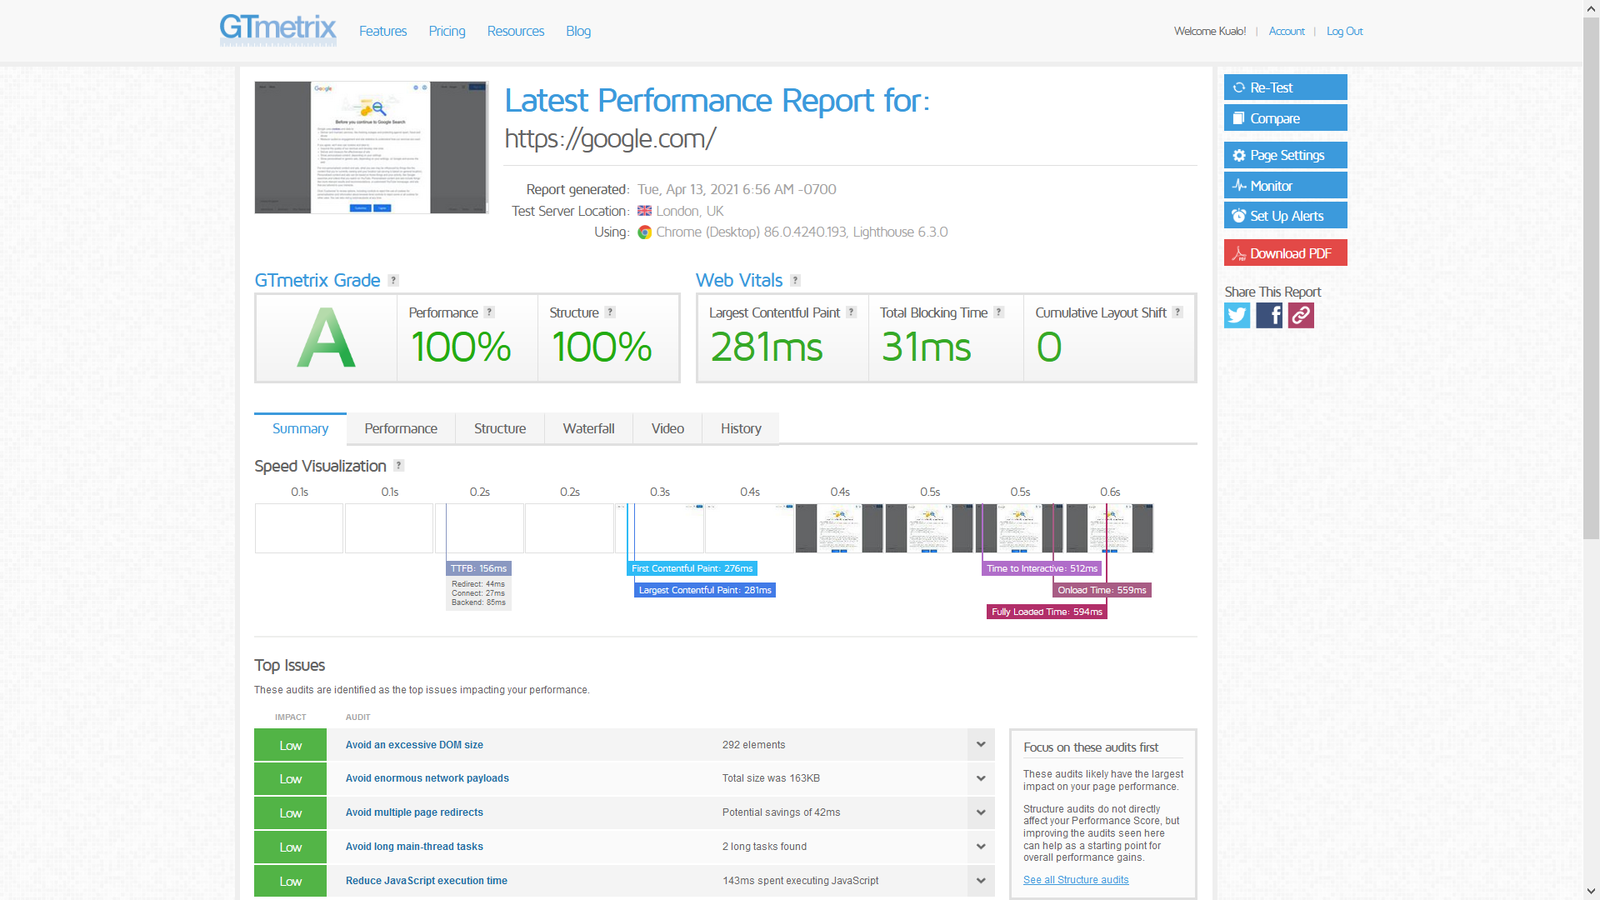
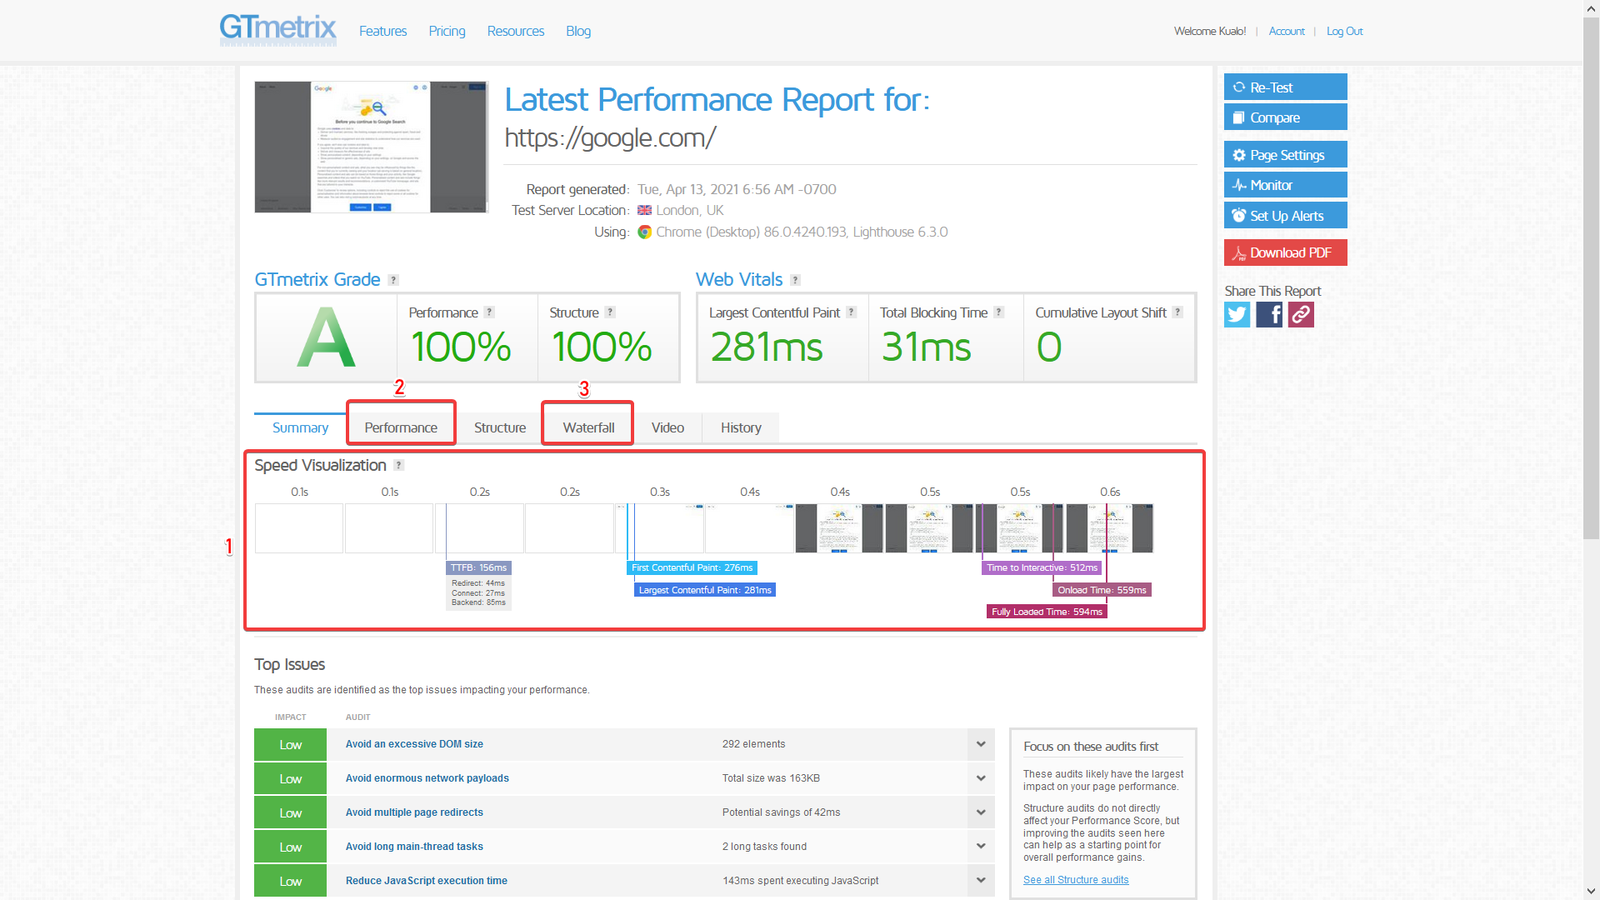
GTmetrix is the most detailed of the three tools. Here is an example result:
Grades do not equal speed
It is tempting to treat an A grade as "fast" and an F as "slow", but that is not quite right. GTmetrix grades your site on a combination of load times and how well its code follows GTmetrix's own recommendations. A genuinely fast site can still receive a D or E if its code does not tick enough of those boxes.
Getting a D or E does not necessarily mean your site is slow.
Running the test from the right location
By default, GTmetrix runs tests from Vancouver, Canada. Kualo's servers are in London (UK) and Tampa, USA. Running from Vancouver adds roughly 75 ms of latency to Tampa and around 136 ms to London - for every single element on the page. A page with hundreds of images, scripts and stylesheets can easily accumulate an extra second or more just from that distance. Always test from the location closest to your server.
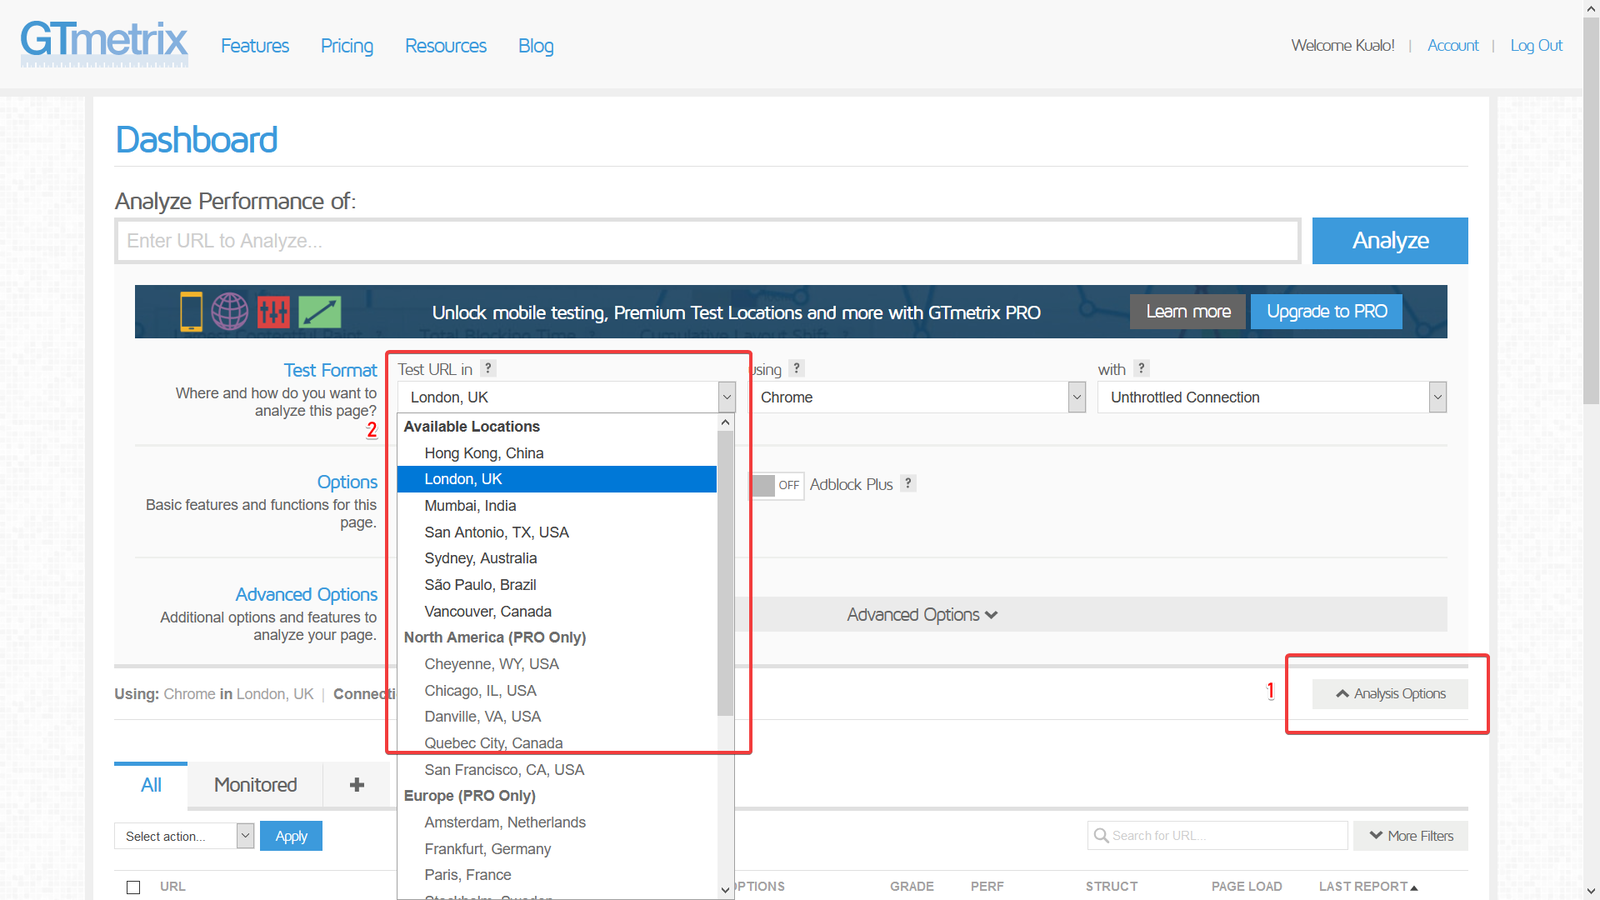
To choose a location in GTmetrix you need a free account. Once logged in:
- Enter your URL.
- Click Analysis Options.
- Select London for UK hosting or San Antonio for US hosting.
- Run the test.
Reading the results
There are three sections worth focusing on:
1. Speed visualisation
The key figure here is TTFB. Target values are:
- 0.5 seconds or less on sites without caching
- 0.2 seconds or less on sites with caching enabled
2. Performance tab
This shows a breakdown of individual timing metrics, each with a brief description and a reference value. The labels are self-explanatory, so review them in context of your own results.
3. Waterfall tab
The waterfall is a timeline showing how every component of your page loads and how long each one takes.
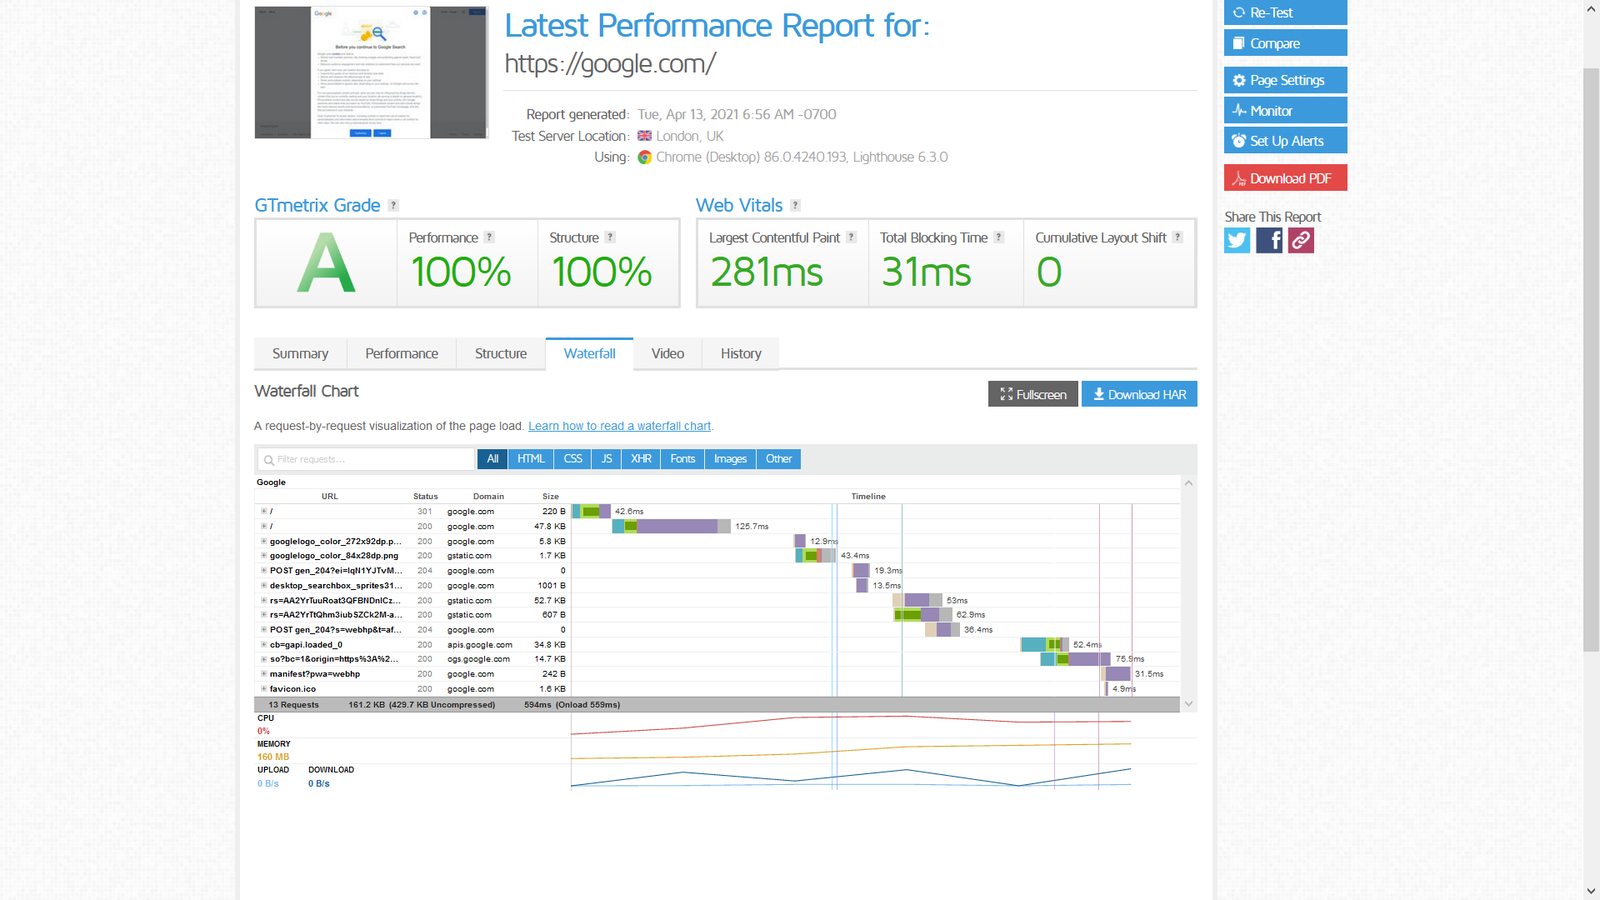
If one component is slow, it can block everything else from loading until it finishes. The type of component tells you how to fix it:
- Oversized images - compress and optimise them (see Kualo's image optimisation guide).
- External CSS or fonts - host the file locally to remove the dependency on a third-party server.
- Slow or excessive JS - defer or disable unnecessary scripts, or reduce how often they run. For WordPress's Heartbeat AJAX, the Heartbeat Control plugin lets you throttle or disable it.
Pingdom
Pingdom provides less detail than GTmetrix but is quick to use and does not require an account.
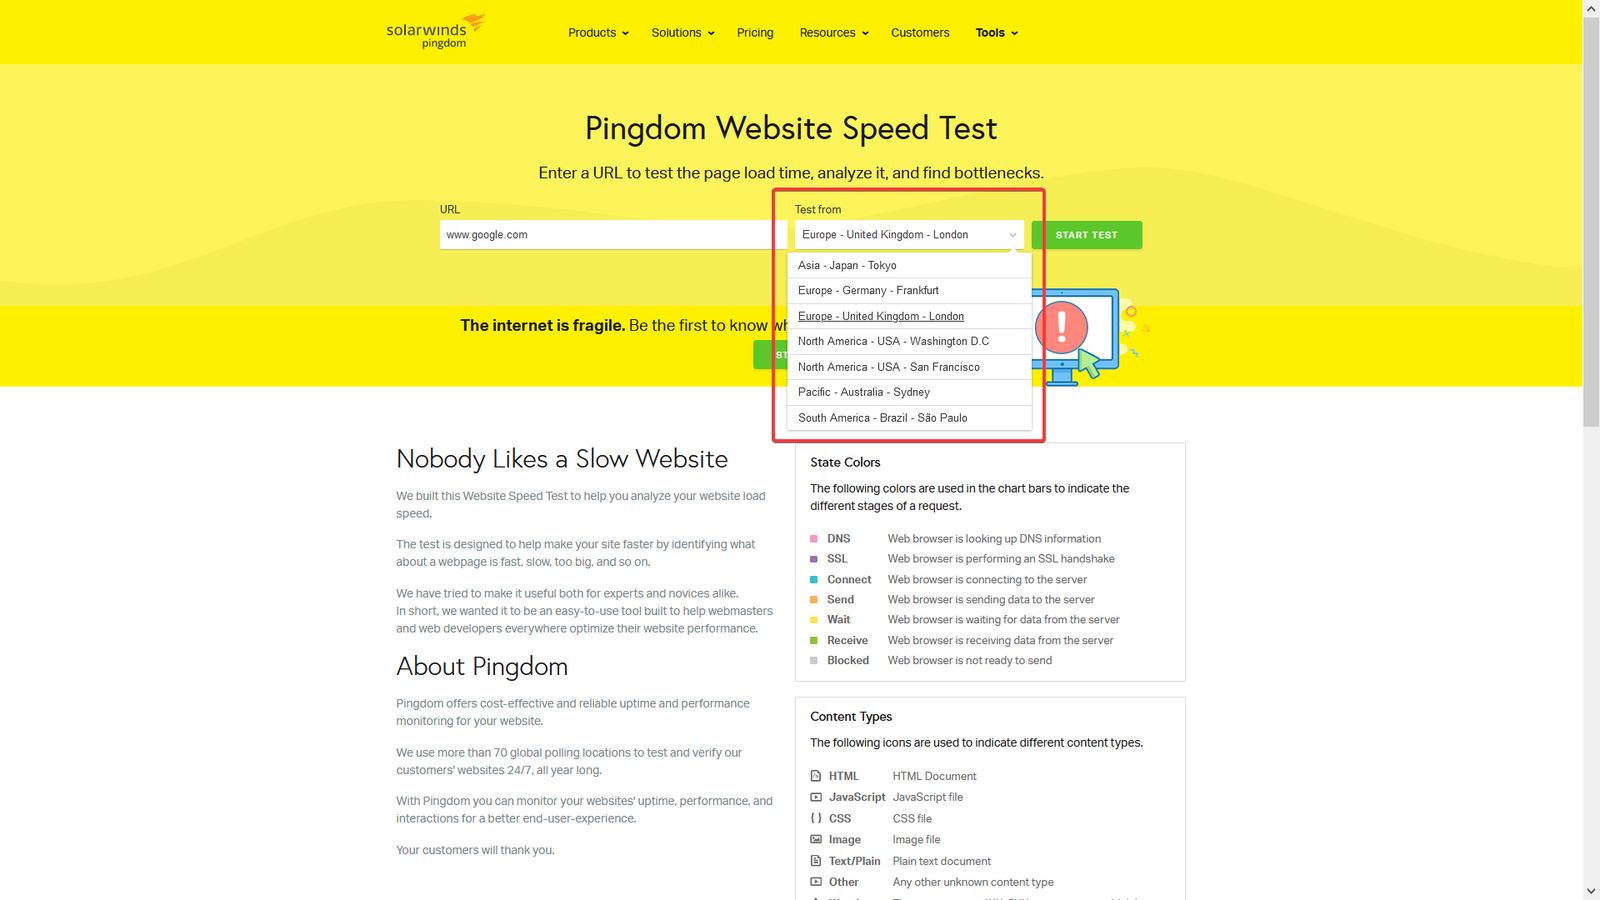
Choosing the right location
Select the test location directly on the Pingdom test page. Use London for UK hosting and Washington DC for US hosting.
Reading the results
All results appear on a single page:
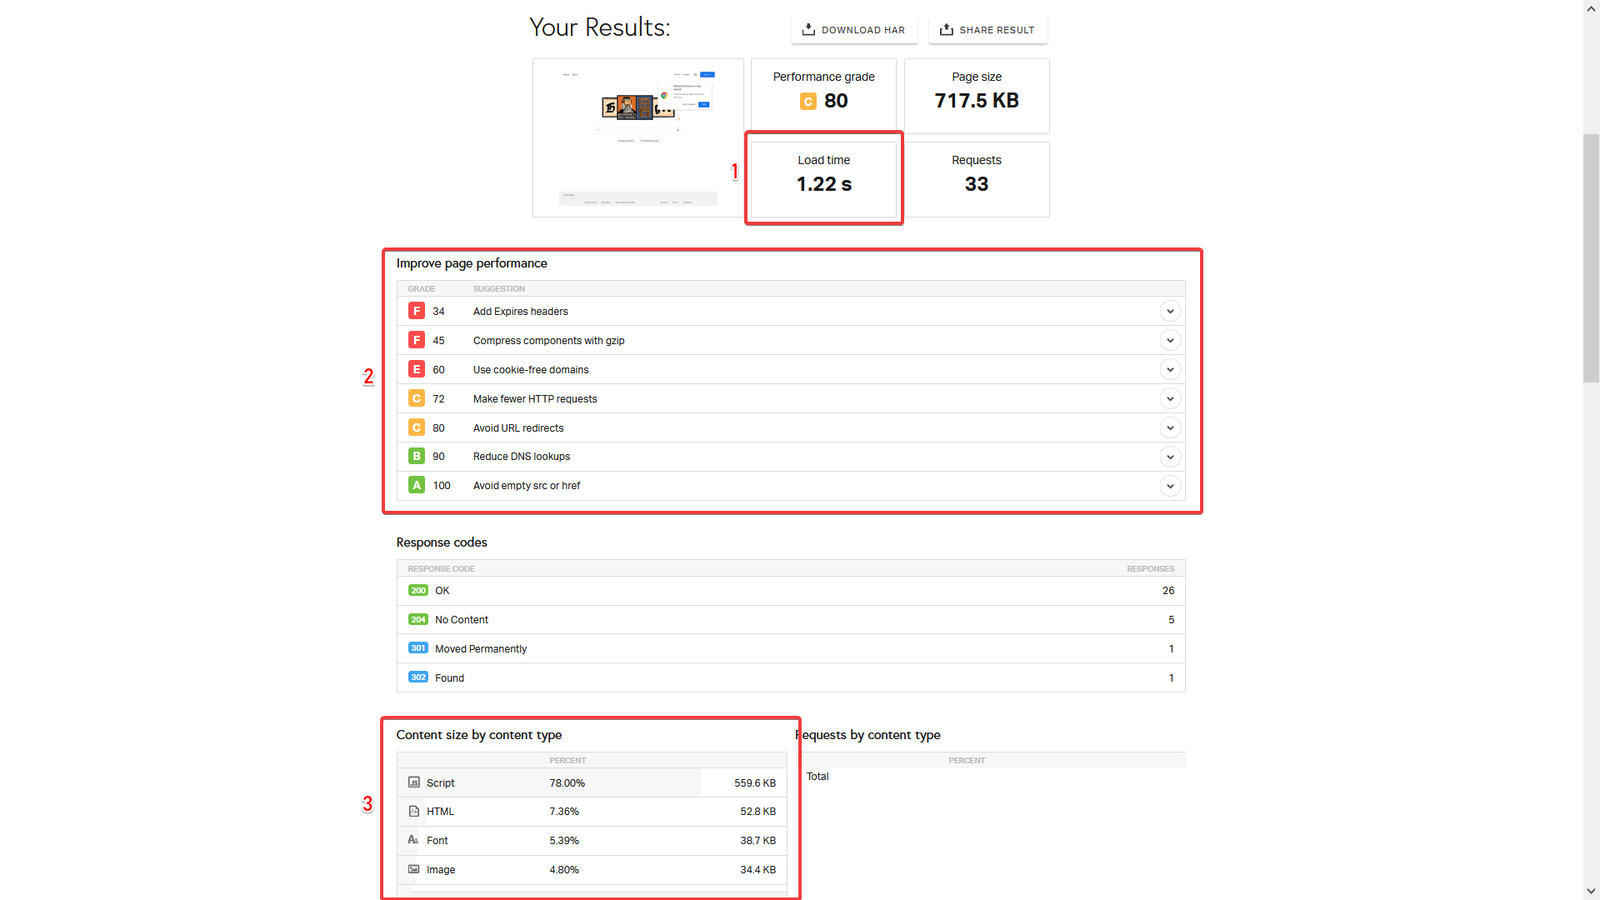
1. Load time
Pingdom gives you a single total load time rather than a stage-by-stage breakdown. It is less granular than GTmetrix but still useful as a quick overall indicator.
2. Performance recommendations
This section covers headers, redirects, DNS lookups, caching and more. Most of these changes require a developer, as they involve configuration or code edits.
Pingdom does not currently detect Brotli compression. Kualo's LiteSpeed servers use Brotli by default, so the compression check will always show as failed even though compression is active. You can safely ignore that specific result.
3. Size by content type
Rather than listing every element individually, Pingdom groups load time by content type (images, scripts, CSS, etc.). This is useful for spotting categories of content that are disproportionately large or slow.
As with GTmetrix, the performance grade reflects far more than raw speed:
Getting a D or E does not necessarily mean your site is slow.
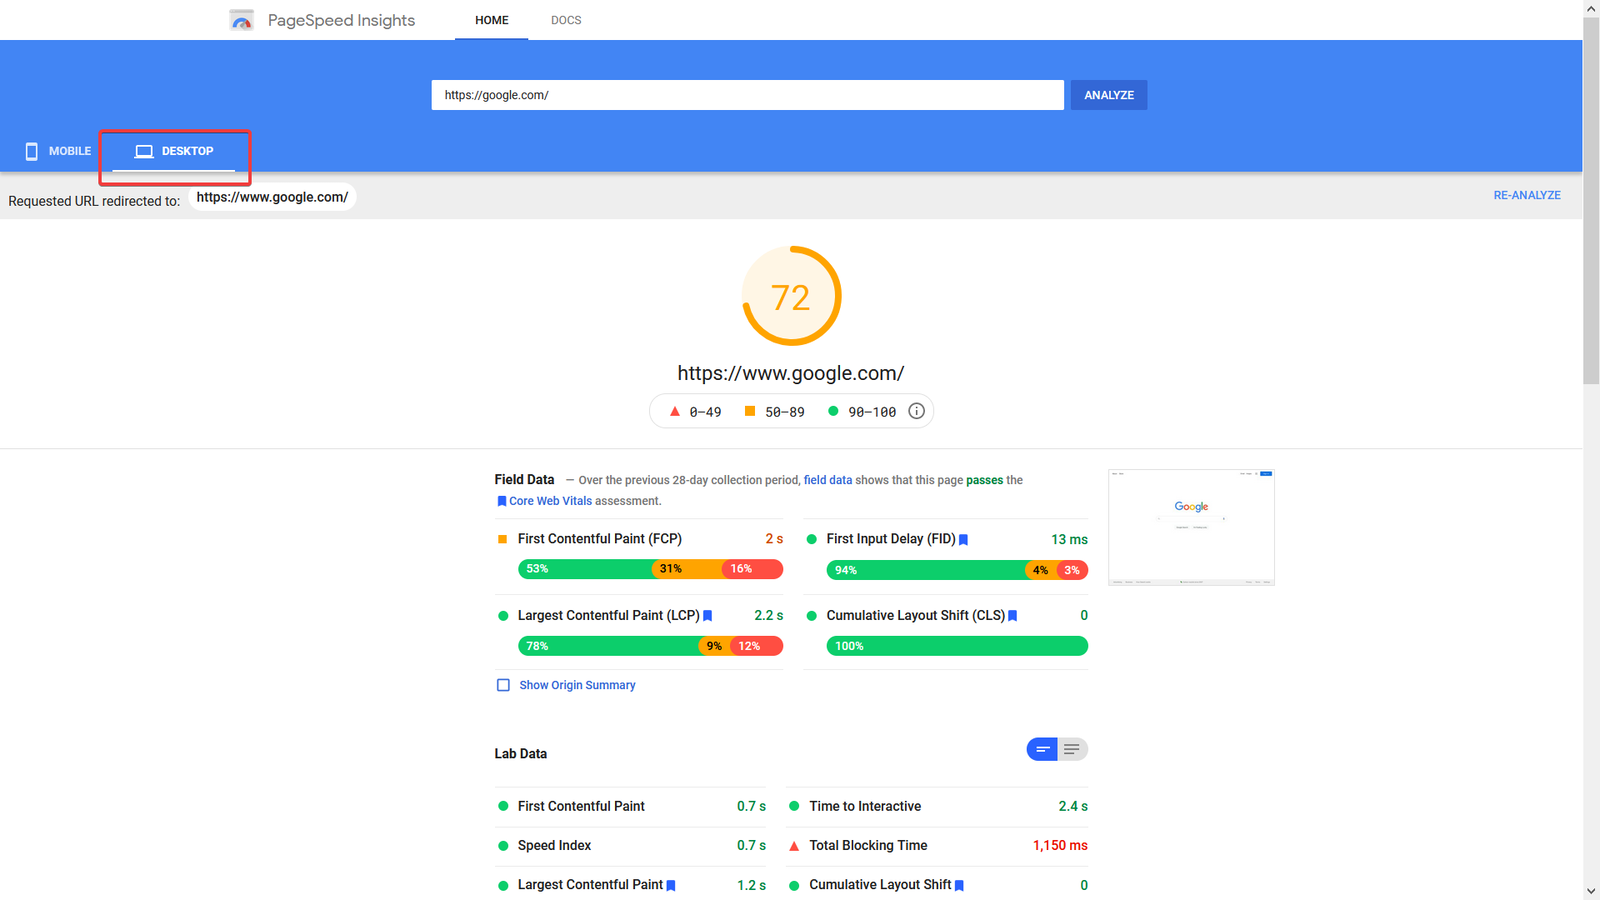
PageSpeed Insights
Google's PageSpeed Insights takes a different approach to the other two tools. Here is an example result:
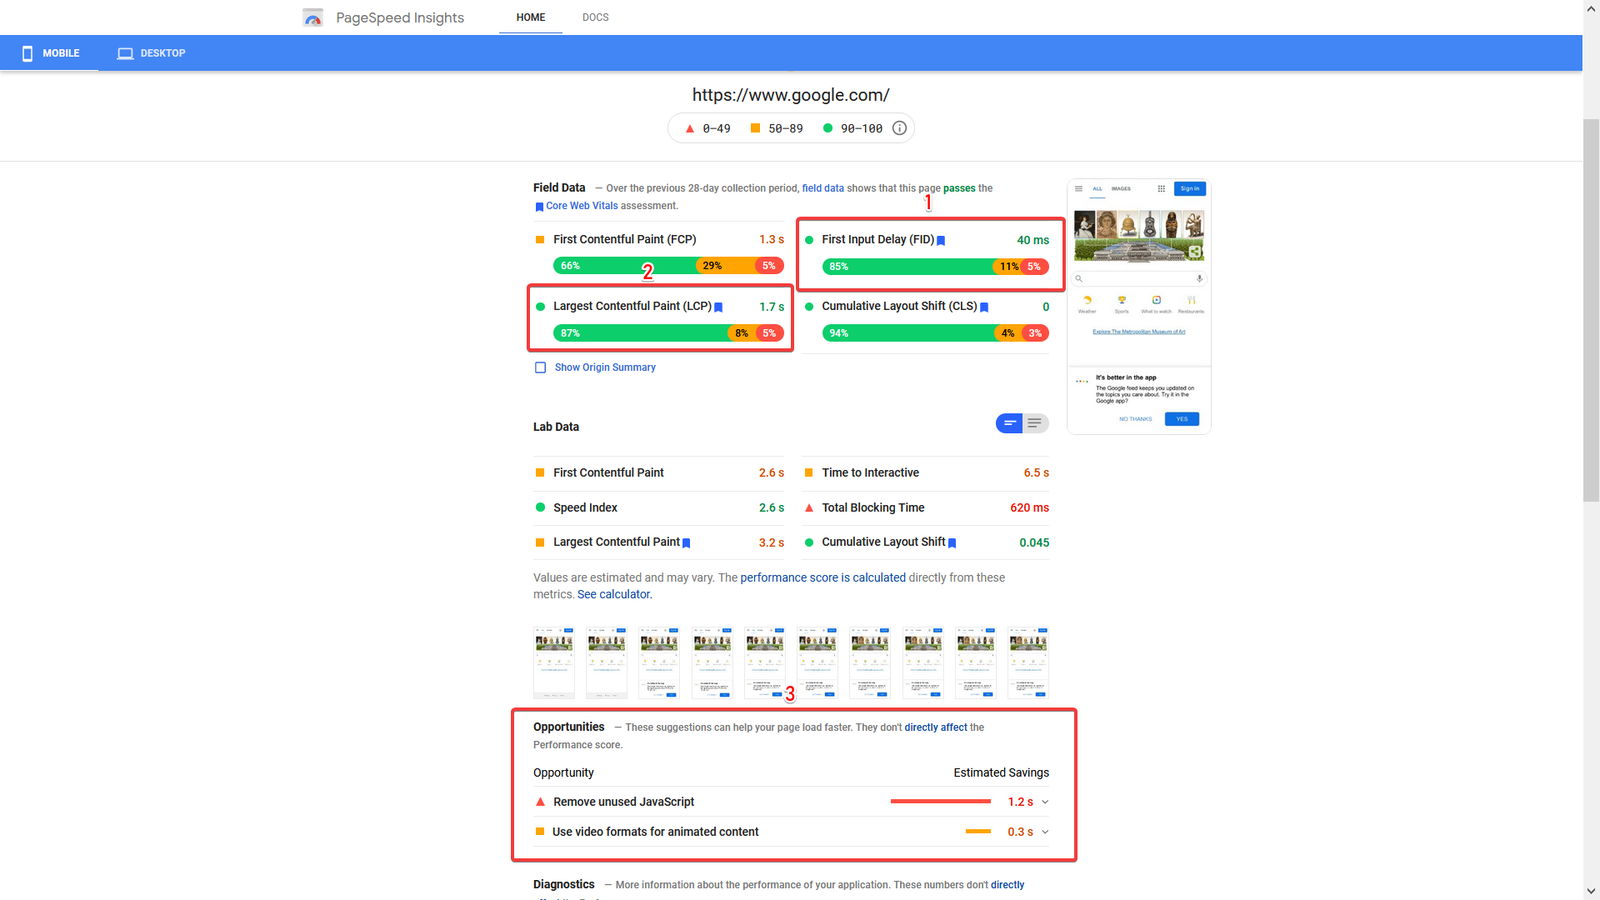
Two important differences
- No location choice - PageSpeed selects the test location automatically.
- Mobile results are shown first - The default view is the mobile report. Because mobile and desktop tests use different criteria, always switch to the Desktop tab before drawing conclusions.
The performance score
Unlike GTmetrix and Pingdom, PageSpeed's score is a closer reflection of actual load times because it does not factor in site structure or redirects. The score is built from several weighted metrics that add up to 100. Google's full explanation of how the score is calculated is published on web.dev.
Key sections to review
1. First Input Delay (FID)
This is broadly comparable to TTFB - it measures how quickly the page becomes interactive. The same advice for improving TTFB (caching, PHP version, database optimisation) applies here.
2. Largest Contentful Paint (LCP)
LCP is equivalent to GTmetrix's Fully Loaded time and Pingdom's Load Time - it measures how long it takes for the main content to appear. Rough benchmarks:
| LCP | Assessment |
|---|---|
| Under 2.5 seconds | Good |
| 2.5 - 4 seconds | Needs improvement |
| Over 4 seconds | Poor - investigate further |
3. Opportunities
Specific recommendations for improving your content and configuration. As with Pingdom's recommendations, most require a developer to implement.
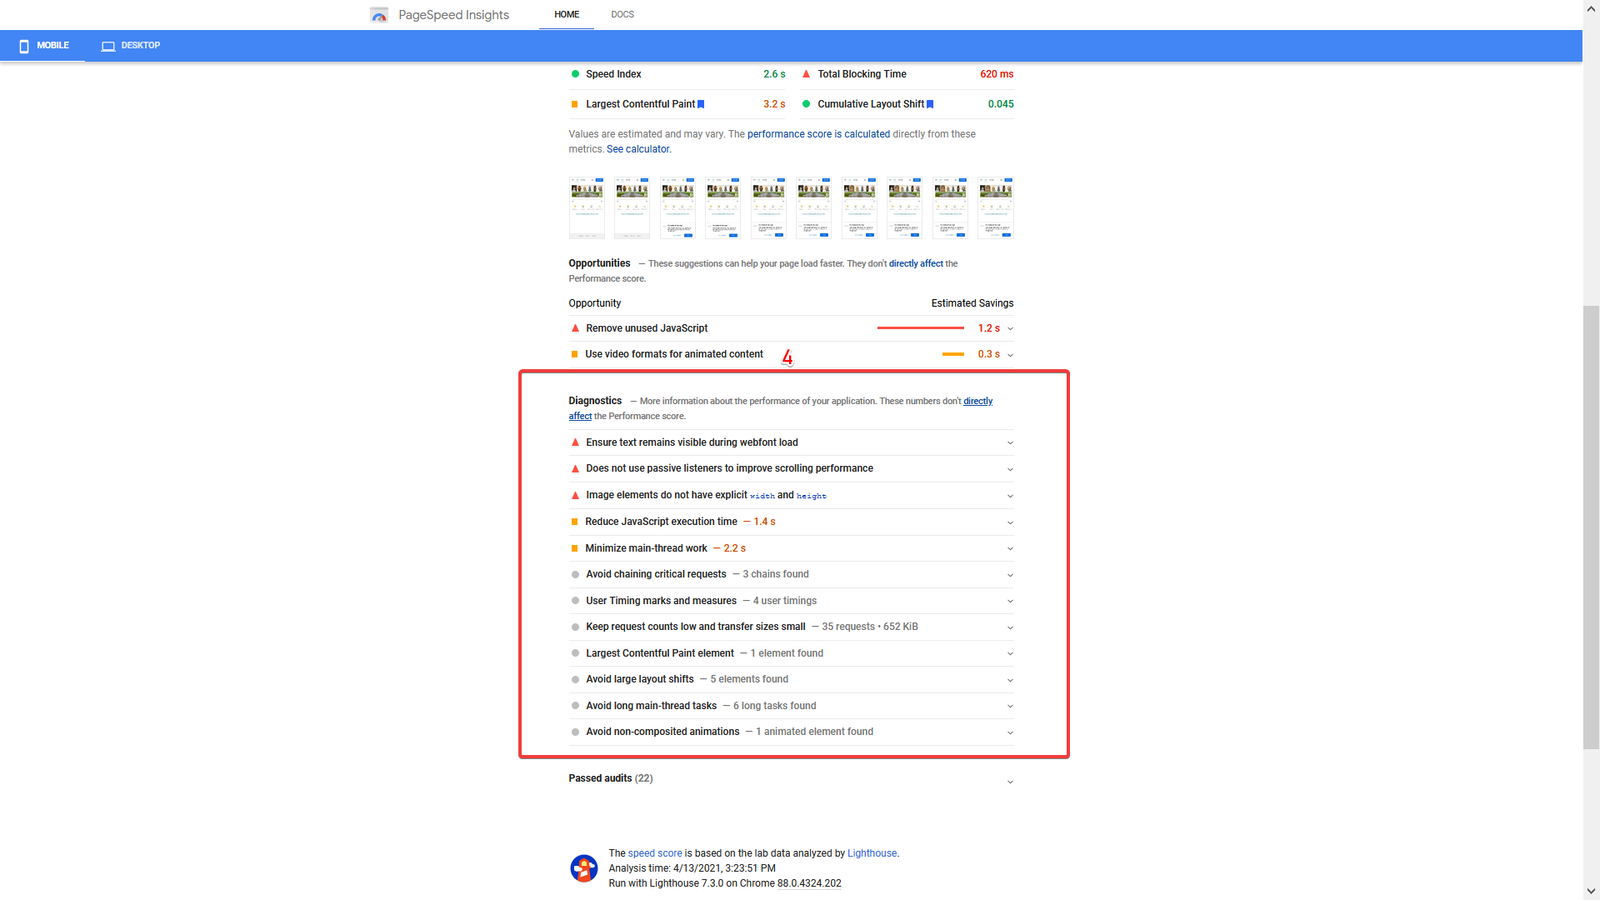
4. Diagnostics
A detailed breakdown of how your page loads, presented in an interpreted, concise format. Think of it as a more readable version of GTmetrix's waterfall - it tells you not just what loaded slowly, but why.
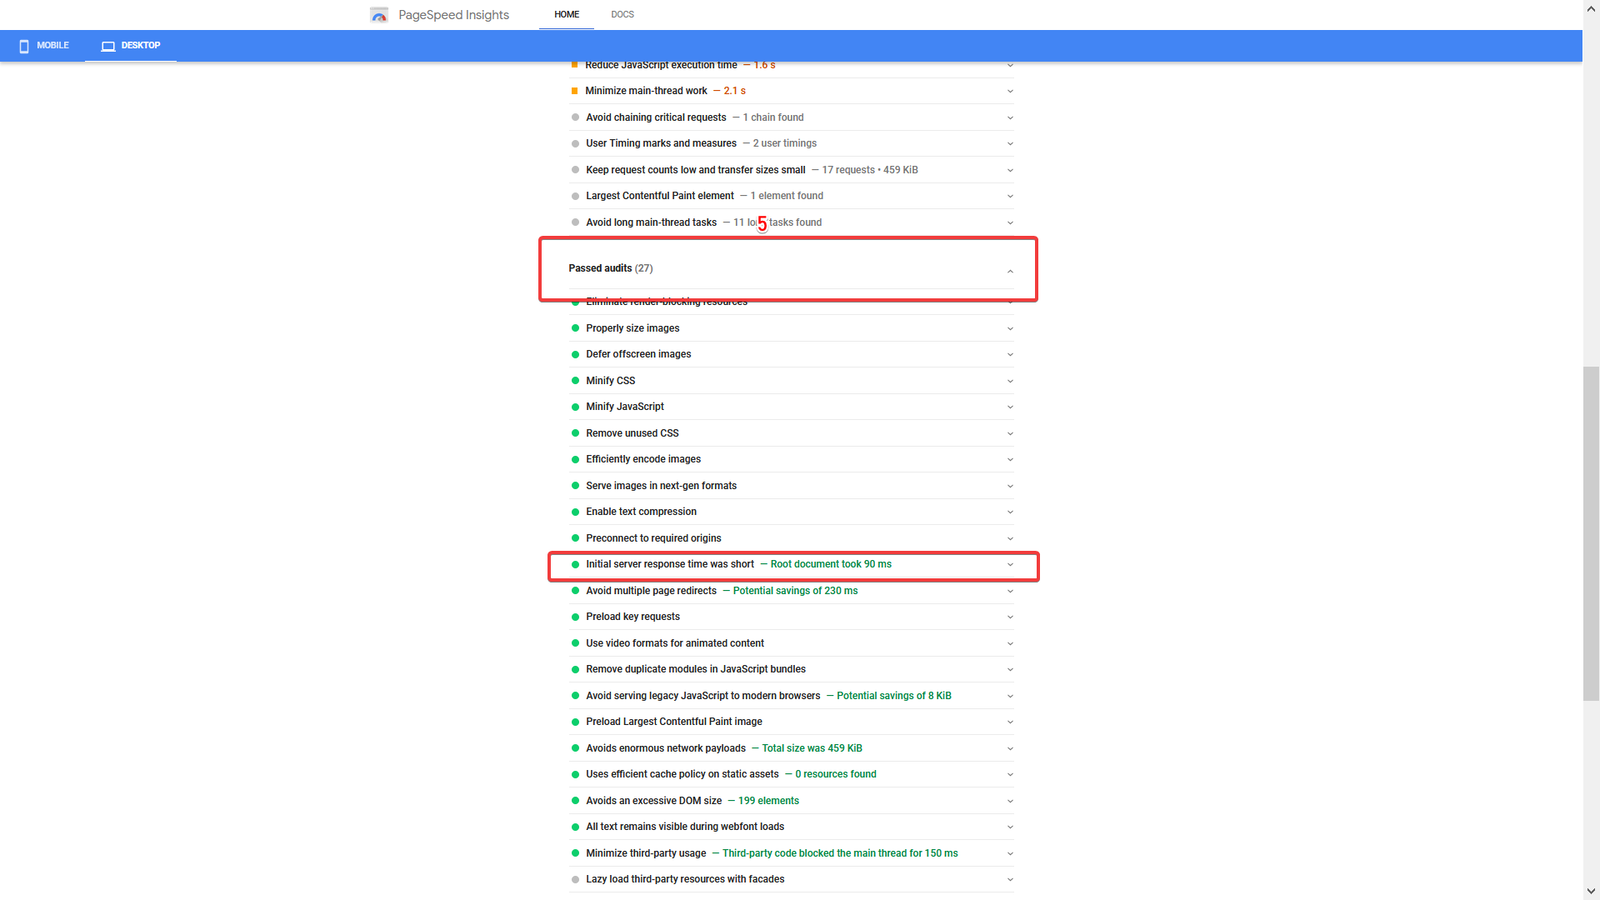
5. Passed audits
This section is collapsed by default. Expand it by clicking the arrow next to it. The most important item to look for here is Initial server response time. If your TTFB is within Google's threshold, it will read "Initial server response time was short" alongside the measured value.