On this page
Profiling slow PHP requests with Xdebug
Use Xdebug profiling to pinpoint the exact function making your site slow, rather than guessing by disabling plugins one at a time.
Modern servers are quick. A fresh WordPress or Magento install on your hosting account would load in well under a second - no cache, no tricks, just a clean install on a modern CPU. But your site doesn't. Maybe pages take five seconds to render. Maybe your CPU usage is suspiciously high for the traffic you're getting. Maybe the public side feels fine but the admin grinds, or everything's fine right up until your LiteSpeed cache expires and the next visitor pays the rendering bill.
The hardware isn't the problem. Something in the site is - something that wasn't there when it was new. Plugins added over the years, a custom theme worked on by three different developers, a page builder with its own ecosystem of add-ons, a WooCommerce installation with five years of accumulated extensions. Somewhere in there, some piece of code is doing far more work than it should on every page load. The question is which piece.
The traditional answer is "turn things off until it gets fast again." Deactivate a plugin, refresh. Deactivate another, refresh. Switch to a default theme, refresh. This works fine if you have five plugins and a simple theme. It works less well if you have eighty plugins, a custom theme, and a checkout that breaks the moment you disable the wrong thing. And critically, it tells you which plugin is the issue, not why - or whether the real cause is something subtler interacting between several of them.
Profiling is the proper way to do this. Instead of guessing what's slow, you ask PHP to record exactly what it spent time doing during a single request - every function called, how long it took, and what called it. The output is a cachegrind file, and it's the difference between "the site feels slow" and "this specific function consumed 7.3 seconds of a 10.5-second page load, and here's the line of code that triggered it."
This article walks through the full profiling workflow on Kualo hosting: how to get Xdebug enabled on your account, how to capture a profile, and how to make sense of the resulting cachegrind file - either using a free utility called QCachegrind, by handing it to an AI assistant like Claude, or by passing it to us for analysis as a paid service.
When profiling is worth doing
Profiling is the right tool when "turn things off until it gets fast" stops working. In practice, that's most of the time:
- The bottleneck is in your theme, not a plugin. Switching to a default theme to test isolates the theme as the issue but tells you nothing about what in the theme is slow. Profiling does.
- The slow code lives inside an essential plugin. You can't simply deactivate WooCommerce or your booking system to see if it's the cause. Profiling lets you see whether a specific function within it is the problem.
- Something innocuous is triggering expensive code. It's not unusual for a check related to a feature you barely use to run on every page of the site, regardless of whether that feature is relevant to the page. You'd never find that by switching plugins on and off.
- You want evidence, not guesses. A cachegrind file is hard to argue with. If your developer says "the theme is fine" and the profile shows the theme's
header.phpis making 14,000 database calls, the conversation moves on quickly.
Do this on staging if you can
We strongly recommend running profiling against a staging copy of your site rather than production. There are three good reasons:
- You can disable caching entirely on staging, which sidesteps a whole category of problems described in Step 3 below. Profiling is most useful on uncached requests, and disabling caching outright is by far the cleanest way to ensure that.
- Your live visitors aren't affected by any extra Xdebug overhead, and you're free to experiment without consequences.
- You can confirm fixes on staging before applying them to production.
If staging and production share the same cPanel account (and therefore the same PHP configuration), enabling Xdebug in PHP Selector will affect both - but the points above still hold.
The workflow at a glance
- Request Xdebug profiling on your account from Kualo support.
- Enable the Xdebug extension in your cPanel PHP Selector.
- Trigger a single profiled request to the page you want to investigate.
- Download the cachegrind file the profiler produces.
- Analyse it using QCachegrind, an AI assistant, or our paid analysis service.
Each step is described in detail below.
Step 1: request Xdebug profiling on your account
Open a support ticket and ask us to enable Xdebug profiling on your account. Tell us which domain you'd like to profile.
Behind the scenes, we'll add a per-user Xdebug configuration that:
- Sets Xdebug to "profile" mode (the variant that produces cachegrind output).
- Configures it to only profile requests that are explicitly triggered - so your site doesn't slow down for normal visitors.
- Writes the output to a private directory under your home folder.
- Sets a unique trigger value that only your support ticket knows about.
We'll reply with the trigger value (a short string) and tell you exactly where your cachegrind files will be saved on your account. This configuration step requires server-level access, which is why we set it up for you rather than leaving it as a cPanel task.
Step 2: enable the Xdebug extension in PHP Selector
Once we've confirmed the configuration is in place, you'll need to enable the Xdebug extension itself in cPanel:
- Log in to cPanel.
- Open Select PHP Version (under Software).
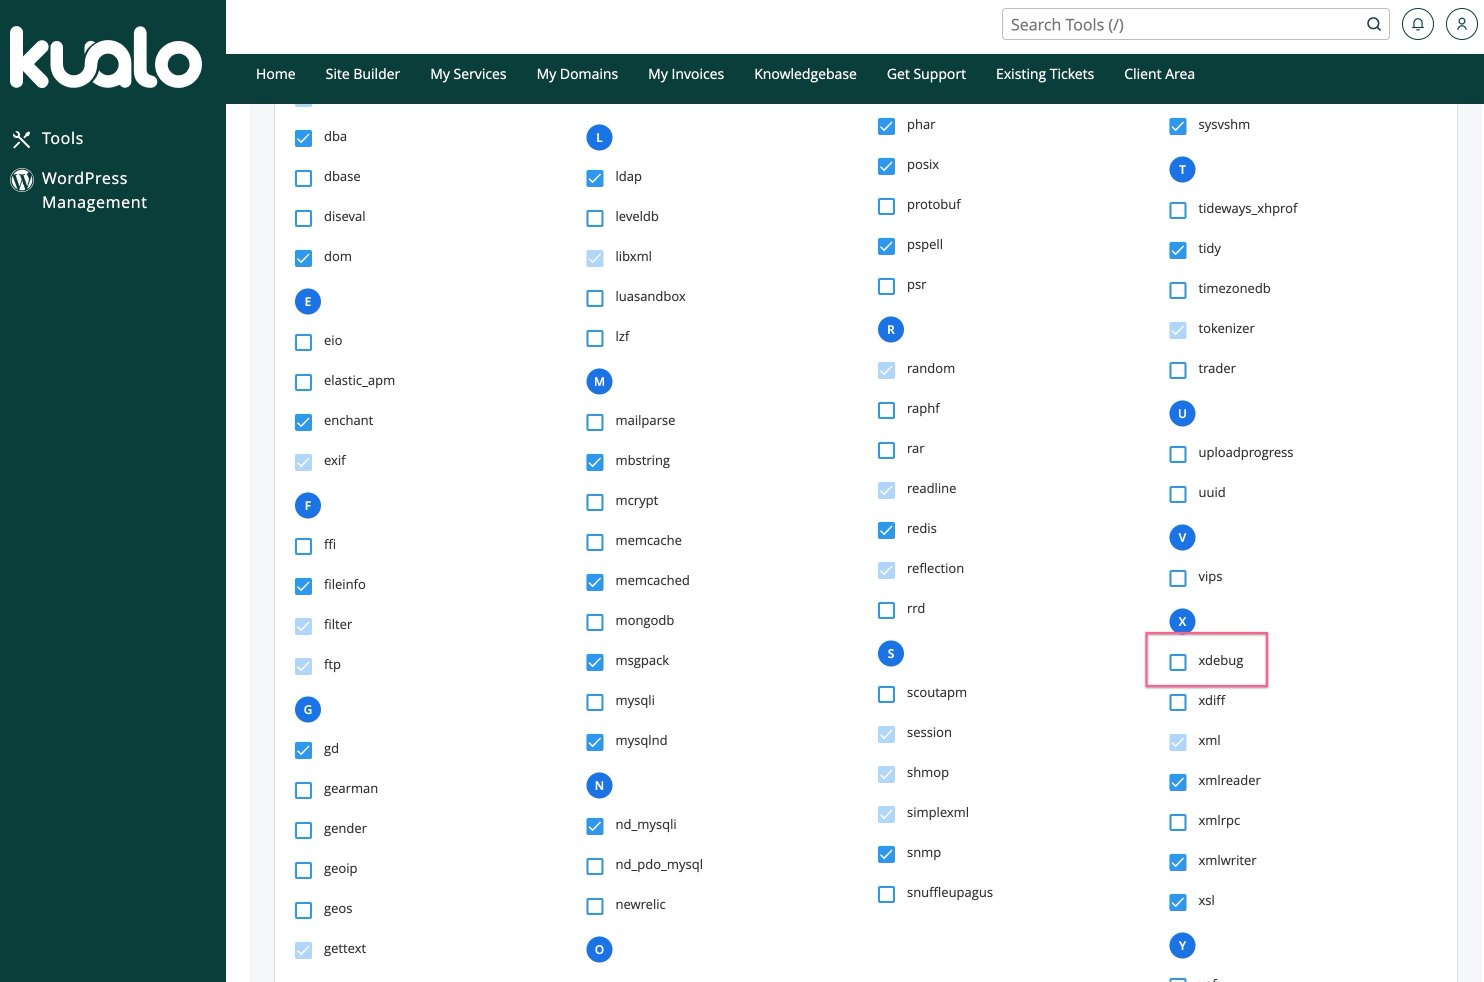
- In the extensions list, tick
xdebug. - Click Save.
For a full walkthrough of PHP Selector, see How to Manage the PHP Version in cPanel Using the Select PHP Version Tool.
Remember to disable Xdebug once you've finished. Even in trigger-only mode, having the extension loaded carries a small per-request overhead. A few hours of testing is fine, but don't leave it enabled indefinitely on a production site.
Step 3: trigger a profiled request on an uncached page
Profiling is configured to only run when you explicitly ask for it, by adding the trigger value to the request - either as a URL parameter or as a header.
The single most important thing to understand here is that you must profile an uncached request. If the page is being served from LiteSpeed Cache, a CDN, or any other full-page cache, what gets profiled won't be your slow PHP - it'll be a near-instant cache hit, which tells you nothing.
There are a few ways to get an uncached request:
- Use staging with caching disabled. This is by far the cleanest option, and the main reason we recommended staging above. Turn caching off entirely and every request you make is uncached.
- Log in as an administrator. Most WordPress and Magento sites are configured to bypass full-page caching for logged-in users. If you're logged into wp-admin (or your Magento admin), the front-end pages you visit will typically be uncached.
- Use a cache-bypass parameter where supported. WordPress sites running LiteSpeed Cache can append
LSCWP_CTRL=NOCACHEto the URL to force a cache bypass on that request. Other caches have their own equivalents; check your plugin documentation. - Find a page that's inherently uncached. Cart, checkout, account pages, and most AJAX endpoints are generally not cached.
For WordPress sites with LiteSpeed Cache, a typical trigger URL looks like this:
https://www.yourdomain.com/some/page/?LSCWP_CTRL=NOCACHE&cb=123456&XDEBUG_TRIGGER=YOUR_TRIGGER_VALUE
The three parameters serve different purposes:
LSCWP_CTRL=NOCACHEforces LiteSpeed Cache to bypass the cache for this request.cb=123456is a cache-busting parameter (any random value works). This prevents intermediate caches from serving a stale version.XDEBUG_TRIGGER=YOUR_TRIGGER_VALUEtells Xdebug to profile this request, using the trigger value we sent you.
For Magento (or any other site), the same idea applies - append XDEBUG_TRIGGER=YOUR_TRIGGER_VALUE to the URL, along with whatever cache-busting your environment needs:
https://www.yourdomain.com/some/page?cb=123456&XDEBUG_TRIGGER=YOUR_TRIGGER_VALUE
Load the page once. The profile is now captured.
For background processes - AJAX endpoints, webhooks, or cron-driven URLs - you can trigger profiling from the command line using curl. Open a support ticket if you need help with that.
Step 4: download the cachegrind file
After triggering the profile, a new file will appear in the directory we told you about, with a name like cachegrind.out.NNNNN.NNNNN. The two numbers are the PHP process ID and a Unix timestamp - useful when you've captured multiple profiles and need to tell them apart.
Download it using either:
- cPanel File Manager - navigate to the directory, select the file, and click Download.
- FTP or SFTP - connect with your usual cPanel credentials and download from the same path.
If no file appears, get in touch - we can check the Xdebug log on the server, which will usually explain why.
Step 5: analyse the cachegrind file
You have three options here, in roughly increasing order of how much you'd like us to do for you.
Option A: analyse it yourself with QCachegrind
QCachegrind (macOS, Linux, Windows) and KCachegrind (Linux) are free utilities for browsing cachegrind files visually. They're the traditional tool for this job and they work very well, though the interface is functional rather than friendly - think of them as a database explorer for performance data: extremely capable, not designed to win design awards.
Installation:
- macOS:
brew install qcachegrind(requires Homebrew, the standard macOS package manager). - Linux:
sudo apt install kcachegrindon Debian/Ubuntu, or your distribution's equivalent. - Windows: Download QCachegrindWin from SourceForge.
Open the cachegrind file. The workflow once it's loaded:
- Switch to the Flat Profile view.
- Sort by Incl. (inclusive time). This shows which functions consumed the most total time across the entire request, including time spent in functions they called.
- Click the top entry. It will almost always be something generic like
{main}orrequire_once. Work down the list looking for the first function that isn't a top-level entry point - that's usually where the interesting story starts. - Use the Callers panel (typically on the right) to see what called the expensive function. This is the key step: most expensive functions are WordPress or Magento core code, and the question you actually want to answer is which plugin or theme is calling them so much.
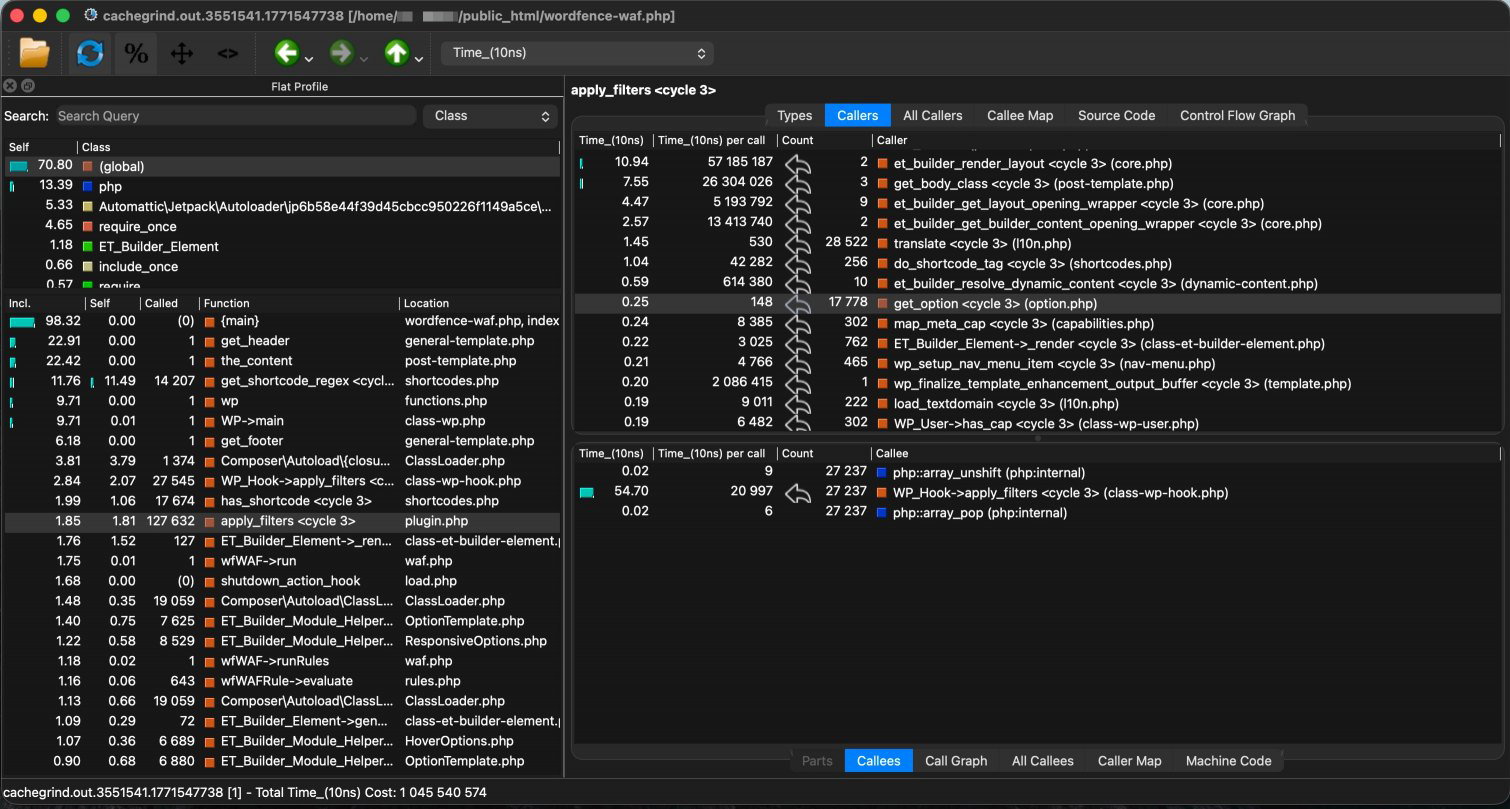
The screenshot above shows a real profile loaded in QCachegrind. The Flat Profile (lower left) is sorted by inclusive time. At the top you can see {main} at 98.32% - the top-level entry point, as expected. Working down past the other top-level entries (get_header, the_content, wp), the first genuinely interesting hot spot is get_shortcode_regex at 11.76% - that's where the investigation begins. Here, apply_filters <cycle 3> has been selected, and the Callers panel on the right shows every function that called it (et_builder_render_layout, the_content, get_body_class, and so on), with call counts. Clicking through those callers traces the chain back to the responsible plugin or theme.
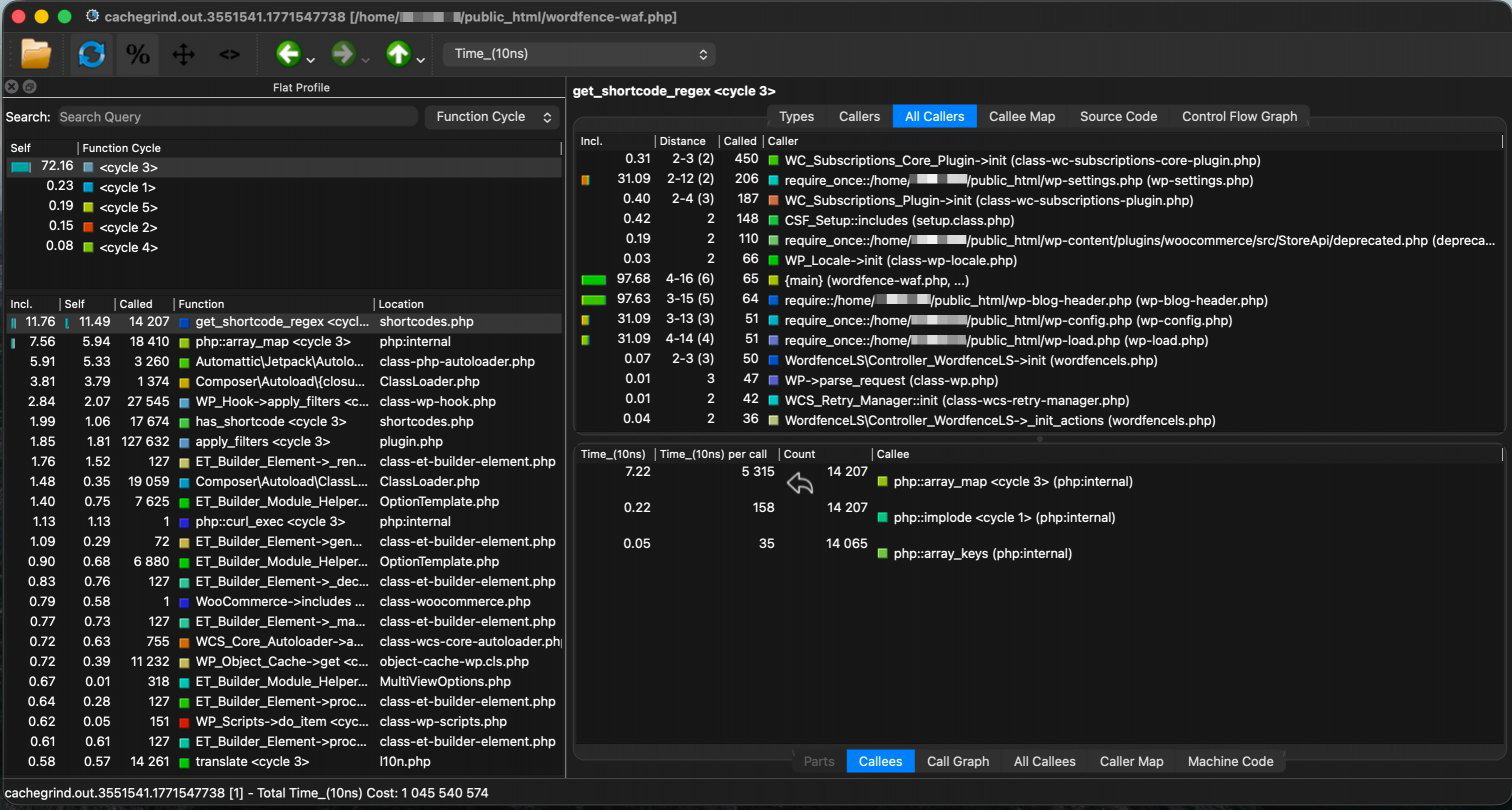
You can see it directly in the profile above: get_shortcode_regex selected on the left, and the All Callers panel on the right showing the breadth of plugins calling into it - WooCommerce Subscriptions, Wordfence, WP_Locale, and others. The Callees panel at the bottom right shows the cost: php::array_map called 14,207 times, accounting for 7.22 of the total 10.5 seconds on its own.
Option B: hand it to an AI assistant
Cachegrind files are large and not designed for human eyes. Modern AI assistants - Claude in particular - are surprisingly good at interpreting them. Claude will write its own analysis code, count function calls, work out the caller chain, and produce a clear narrative explanation of what your site is doing wrong. For non-trivial profiles this can be faster and more readable than working through QCachegrind by hand.
File size. Cachegrind files can be sizeable - anywhere from a few hundred KB to tens of MB depending on how complex the request was. Claude's web interface accepts files up to 30 MB per upload, and other AI tools have their own limits. If your file is too large, compress it first: Claude accepts .zip and .tar.gz archives and will decompress them. A gzip cachegrind.out.NNNNN.NNNNN will typically reduce the file by 80-90%, easily bringing it within the upload limit.
A suggested prompt:
Analyse this Xdebug cachegrind profile. Identify the top functions by inclusive time. Trace the caller chain to identify which plugins or themes are responsible. Summarise the likely root cause of slowness and recommend next debugging steps.
Privacy. Cachegrind files contain function names, file paths, line numbers, and timings. They do not contain code, argument values, request bodies, or database query content - so the privacy footprint is smaller than people often assume. What they do contain is file paths that include your cPanel username and the names of every plugin and theme on the site. Have a quick look at the file in a text editor before uploading if any of that is sensitive.
Before uploading to any AI provider, make sure you're on a plan that doesn't use your inputs for model training, or that you've explicitly opted out in your account's privacy settings. Different tools have different defaults, and those defaults can change.
Option C: ask us to analyse it for you
If you'd rather not work through this yourself, we offer cachegrind analysis as a paid service. Open a support ticket telling us you'd like to take this option and we'll send you a quote. Once you confirm, tell us where the file is on your account (or send us the trigger workflow) and we'll produce a written analysis covering: what the bottleneck is, which plugin or theme is responsible, what the underlying mechanism is, and what we'd recommend doing about it. This is usually faster and more decisive than self-analysis, particularly for Magento profiles, which tend to be denser than WordPress ones.
What you're likely to find
In our experience, slow PHP requests on real-world sites usually trace back to one of a small set of patterns:
- Heavy shortcode recursion (WordPress) - page builders that store content as nested shortcodes can spend disproportionate amounts of time inside
has_shortcode(),do_shortcode(), orget_shortcode_regex(), particularly if the site has accumulated lots of registered shortcode tags from various plugins. - Excessive hook and filter overhead (WordPress) -
apply_filters()dominating a profile with hundreds of thousands of calls typically points to a plugin-heavy stack where filters are being called inside tight loops. WooCommerce sites with many extensions are especially prone to this. - Thousands of database lookups for the same thing -
get_option()or equivalent showing call counts in the tens of thousands usually means something is querying settings inside a loop instead of caching the result once. - Magento-specific patterns - synchronous indexers that should be scheduled, EAV attribute lookups made per-product inside a loop rather than in bulk, third-party modules duplicating work that core already does.
A worked example
To put some flesh on the bones: we recently worked with a customer running a Divi-themed WooCommerce site that was taking around 10.5 seconds per page load. Profiling immediately showed where the time was going - 7.3 of those 10.5 seconds were being spent inside the WordPress has_shortcode() function.
The cause was a single function in Divi's WooCommerce integration that was running shortcode checks on every page load, including pages with no WooCommerce content. The site had accumulated 253 registered shortcode tags from various plugins over the years, and has_shortcode() was being called repeatedly against this enormous list. Worse, 108 of those 253 shortcode tags turned out to be completely unused - legacy social-sharing shortcodes from circa 2012, defunct WooCommerce extensions, abandoned page-builder modules. Dead code being checked thousands of times per page.
No amount of "deactivate a plugin and refresh" would have found this. The trigger was a check for WooCommerce functionality. The cost was scattered across 253 registered shortcodes. The two were never near each other in any plugin's settings page. Profiling found it in one request.
What to do once you've found the culprit
Identifying the responsible plugin, theme, or module is the hard part. What happens next depends on what you found:
- If it's a plugin you don't really need, deactivate it through the WordPress or Magento admin in the usual way, or by renaming the plugin folder via File Manager or FTP if the admin isn't accessible.
- If it's a plugin you do need, check whether the slow behaviour is something configurable, whether there's an alternative plugin that does the same job more efficiently, or whether the plugin author has acknowledged the issue.
- If it's the theme, the fix is usually some development work - caching expensive operations, reducing repeated database lookups, or refactoring the section of code that's hot.
- Sometimes the fix is a small custom workaround. AI coding tools - Claude Code, GitHub Copilot, or similar - can help you write a small custom plugin (or theme override) that limits the impact of the bottleneck without removing the underlying feature. In the worked example above, the customer shipped a small plugin that simply deregistered the unused shortcodes the Divi WooCommerce check was cycling through. Page load times dropped from around 10.5 seconds to well under a second, with no visible change to the site at all.
Whichever path you take, re-profile the same page and compare. If the function that was at the top of the flat profile has vanished or shrunk, you've confirmed the fix.
Important: disable Xdebug when you're finished
Once you've finished investigating:
- Open cPanel Select PHP Version.
- Untick the
xdebugextension. - Click Save.
The server-side configuration we put in place is harmless once Xdebug itself is disabled, but if you'd like us to remove it entirely, send us a quick ticket and we'll tidy up.
Summary
The shift from "the site is slow" to "this specific function consumes 70% of every page load, and here's the line of code that triggers it" is the entire game. Most performance problems aren't really "the whole site is heavy" - they're one or two specific bottlenecks hiding inside a perfectly capable hosting environment, and a single profile will usually find them in under an hour of careful work. The alternative is weeks of plugin-juggling, intuition, and hope.
If you've already done the obvious things - caching, image optimisation, deactivating plugins you weren't really using - and you're still stuck, this is the next step. Open a ticket and we'll get you set up.